
Lesson 4 - Wort and Beer Analysis
This lesson looks at how to analyse the composition of wort and beer. It covers the current methods for each analysis, outlining the basics of how they are undertaken. It then explains the methods and standards used to ensure that analysis is both precise and accurate. Finally, it discusses how laboratories collaborate so that proficiency levels can be determined.
Setting Specifications
All beer should be perfect and all lab analyses should be precise and accurate. However, there are variations at all stages of production and the results of all lab analyses vary to some extent. In this section we will discover what we need to do to develop robust specifications for our beer and analyses. First we look at how we term the reliability of our methods of analysis.
Repeatability r95
Repeatability r95, or within-lab variation, is a measure of the consistency of results from a method using:
-
The same experimental tools
-
The same analyst
-
The same measuring instrument, used under the same conditions
-
The same location
-
Repetition over a short period of time
-
The same objectives
The ‘95’ relates to the confidence level of the accuracy. If the same method, technician, and equipment were used for the same sample at the same time then the result produced would fall within the defined range 95% of the time or 19 times out of 20. The range is often given as the mean of the analyses results and then a figure which is the variation about the mean. For example, for method 19.9 in Analytica EBC for the measurement of calcium in beer by atomic absorption spectrophotometry, the mean figure is 22 mg/L and the r95 is 3.7 mg/L.
Reproducibility R95
Reproducibility R95, also called between-lab variation, is a measure of the consistency of results from a method using:
-
Different experimental tools
-
A different analyst
-
A different measuring instrument
-
A different lab
-
Testing at different times
Again, the ‘95’ relates to the confidence level so, in the above conditions, the result obtained from analysis on the same sample would be within the stated range 19 times out of 20. R95 is virtually always higher than r95. With our example of calcium levels the R95 is 14.6 mg/L. R95 figures are established by EBC, ASBC, and MEBAK with the use of a number of large brewery or independent analytical labs.
Why set specifications?
Specifications enable us to consistently meet the needs and expectations of our customers. We need to set specifications to give us a target to aim for and a realistic range of values over which variation is acceptable to the customer. The target and the range must be achievable within the variation of the process when it is operating in control. The range must also encompass the R95 for the analytical process. There would be little point in setting a spec where analytical errors consistently led to good product being classed as out of spec. So how do we set these ranges?
Specification ranges (tolerances)
As we saw earlier, R95 are available for most methods so we can use these to set a minimum range or band width. We can also use data from the process using statistical process control (SPC). We will start with this SPC approach.
Band width using SPC
As we saw in the Quality Assurance and Quality Management lesson, data within a process are usually assumed to be distributed normally about the mean. The spread of data is represented by the standard deviation, σ. For each σ level that we move away from the mean, the greater amount of data is included. The figure below shows the percentage of data which is included, and so variation explained, for each standard deviation away from the mean.
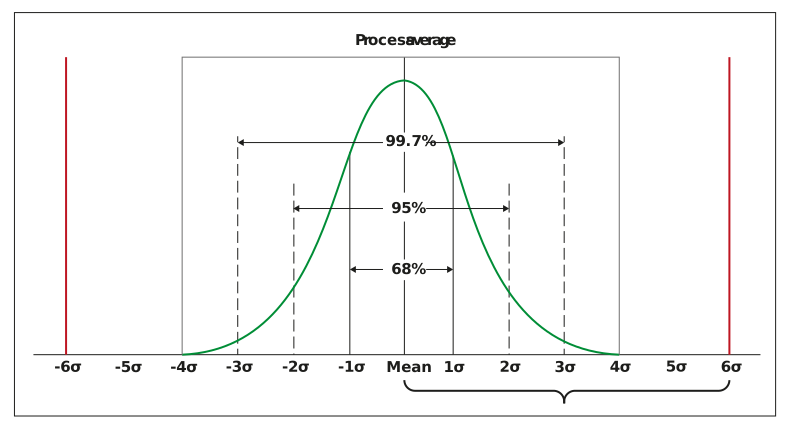
Figure: Normal distribution and standard deviations
To ensure we capture all possible variation, we use 6 x σ and beyond as the band width for our specification. The specification band width is the interval between upper A2 and lower A1 limits. The ratio of the specification band width to 6 x σ is termed the process capability (Cp) and is shown in equation 1 below.
Equation 1:

The table below shows the rate of rejects to be expected for a range of process capabilities.
Table: Rejects based on process capability
|
A2 - A1 |
6 x σ |
8 x σ |
10 x σ |
12 x σ |
|
Cp |
1 |
1.33 |
1.66 |
2 |
|
Reject Rate |
0.27% |
64 PPM |
0.6 PPM |
2 PPB |
The goal is to have a Cp value that is as high as possible, but at least 2 is usually recommended for setting a specification band width. Let us work through an example:
We have a beer with a target colour of 10 EBC. We have undertaken analysis of samples of the beer from BBT over two months and calculated the variance of colour to be 0.0576 EBC. From this we can calculate σ.


To work out our band width we rearrange Equation 1 above and use 2 as our process capability to get:


This is the band width so we need to divide it by 2 to get the figure by which it varies from the target value 10 EBC. The specification is therefore:

In the next method we use R95 and SPC principles to set the band width.
A beer has a colour target value 10 EBC and R95 is 0.68 EBC.
R95 has been established in ISO 5725 to be 2.8 x standard deviation (where standard deviation is an estimate of the true standard deviation σ). So, we need to divide R95 by 2.8 to get the standard deviation.

And to work out our band width we rearrange equation 1 above and use 2 as our process capability to get:
This is the band width so we need to divide it by 2 to get the figure by which it varies from the target value 10 EBC. The specification is therefore:
Band width using ISO 4259
Before we look at using the ISO 4259 standard it is important to note that it relates to precision of measurement methods and results for petroleum and related products. This means samples it deals with are likely to be more homogeneous than brewery samples so will not have the same problems with sampling.
ISO 4259 states that specification limits should be expressed as 'not less than' or 'not greater than'.
Limits may be either:
-
A double limit, upper and lower (colour or bitterness for example)
-
A single limit, upper or lower (upper for ATNC or lower for friability, for example)
The value chosen for the specification limit should take into account R95 for the method. For a double limit the specified range should not be less than 4 x R95 or:

Using our 10 EBC target above, the recommended specification band width would be:

So, as above, we divide by 2 to get the difference of specification limits to the target:

So, our specification is not less than 8.64 EBC and not greater than 11.36 EBC.
For specifications where this is a single limit, there will often be another physical limit, 0 or 100% for example. In these cases, the limits should be constructed so that they are greater than or equal to 2 x R95 from the physical boundary.
Simple probability calculations – variance, standard deviations, and the z-score
We have encountered normal distributions and standard deviations a number of times throughout the Quality Management unit. Now we are going to discover how to calculate it. This is the formula for the standard deviation, or s, where X = the individual result, xbar = the mean result, and n = number of results:

We will work through this in an example. We have the results from multiple spectrophotometric analyses of colour for a brand of beer in BBT in the last few months and have selected a sample of five results to use for our calculation. Here are the results in the sample.
|
Analysis No. |
Result |
|
1 |
10.08 |
|
2 |
10.11 |
|
3 |
10.09 |
|
4 |
10.1 |
|
5 |
10.12 |
To determine the mean for the sample, we simply sum the analysis results and divide by the number of analyses, which gives us 10.1
Next we calculate the (x – xbar)2 for each of the results:
(10.08 – 10.1)2 = 0.0004
(10.11 – 10.1)2 = 0.0001
(10.09 – 10.1)2 = 0.0001
(10.1 – 10.1)2 = 0.0000
(10.12 – 10.1)2 = 0.0004
Then we sum these (x – xbar)2 figures, which gives us 0.001.
We have five results so n – 1 = 4 (if we were using all the results for all the analyses on the brand in BBT we would use n rather than n – 1 as we would have all the data in a population and hence know the true mean).
Dividing the sum of (x – xbar)2 by n – 1 gives us our variance which is

This means our equation will now be:

This give us a standard deviation of 0.0158 EBC.
Knowing the mean and standard deviation means we can calculate the z-score. The z-score is defined as how many standard deviations a figure is away from the mean. It is calculated by this equation:

So, we can calculate the z-score for analysis number 5 from our last example.
Analysis number 5 had a value of 10.12 EBC so inserting this, our mean, and standard deviation into the equation we get this:

So, analysis number 5 is 1.26 standard deviations from the mean. Z-scores are negative for figures below the mean and positive for figures above the mean. The larger the z-score for a measurement the less representative of the mean it is. Z-scores above or below a certain level suggest the result is questionable. Most scientific calculators will calculate means, variances, standard deviations, and z-scores. Spreadsheet software will also calculate them directly from results data.
This concludes what we need to know about how we set specifications and how we use simple statistics to investigate variation in results. Next, we will learn about laboratory standards and how laboratories collaborate to ensure results are valid.