
Lesson 4 - Wort and Beer Analysis
This lesson looks at how to analyse the composition of wort and beer. It covers the current methods for each analysis, outlining the basics of how they are undertaken. It then explains the methods and standards used to ensure that analysis is both precise and accurate. Finally, it discusses how laboratories collaborate so that proficiency levels can be determined.
Analyses on Wort and Beer (Ions)
Ions can be heroes or villains in beer. They range from poisonous to essential for making good beer. We now discover how to measure them in their various forms.
Metal ions by Atomic Absorption Spectroscopy (AAS)
AAS is a versatile technique for measuring metal ions in wort and beer. The technique involves aspirating (spray atomising) an aqueous solution of the sample, along with a fuel, into a flame. As the metal is heated in the flame it absorbs radiation emitted by a hollow cathode lamp at a characteristic wavelength. Absorption at this wavelength is measured. The figure below shows the components.
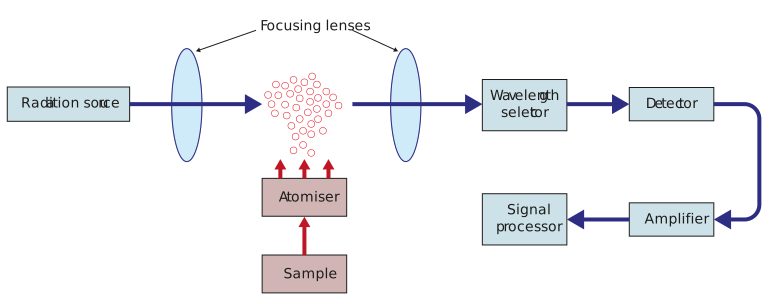
Figure: Atomic Absorption Spectrometer
The concentration of the metal is extrapolated from a standard curve produced by running standard samples of the metal in solution through the machine. It is accurate down to 0.05 mg/L for most metals of interest. The following table shows some of the metals and their characteristic absorbance wavelengths.
Table: Characteristic absorbance wavelengths for metal ions in AAS
|
Metal |
Wavelength (nm) |
|
Iron |
248 |
|
Copper |
324.7 |
|
Potassium |
766.5 |
|
Calcium |
423 |
|
Magnesium |
285.2 |
|
Sodium |
589 |
|
Zinc |
213.9 |
Anions in beer by ion chromatography
We can measure the concentration of the anions, chloride, phosphate, nitrate, and sulphate in beer and wort by using ion chromatography. Ion chromatography is similar to the process of HPLC that we discovered earlier, only the stationary phase is an ion exchange column. Affinities of the components to the column are based on charge interaction. A suppressed conductivity sensor is used on the outlet of the column to detect the ions as they are eluted. The peaks on the chromatograph for each of the samples are then used to calculate concentrations by comparison with the data from the standard curves. Below is an example of a chromatogram from an ion chromatograph.
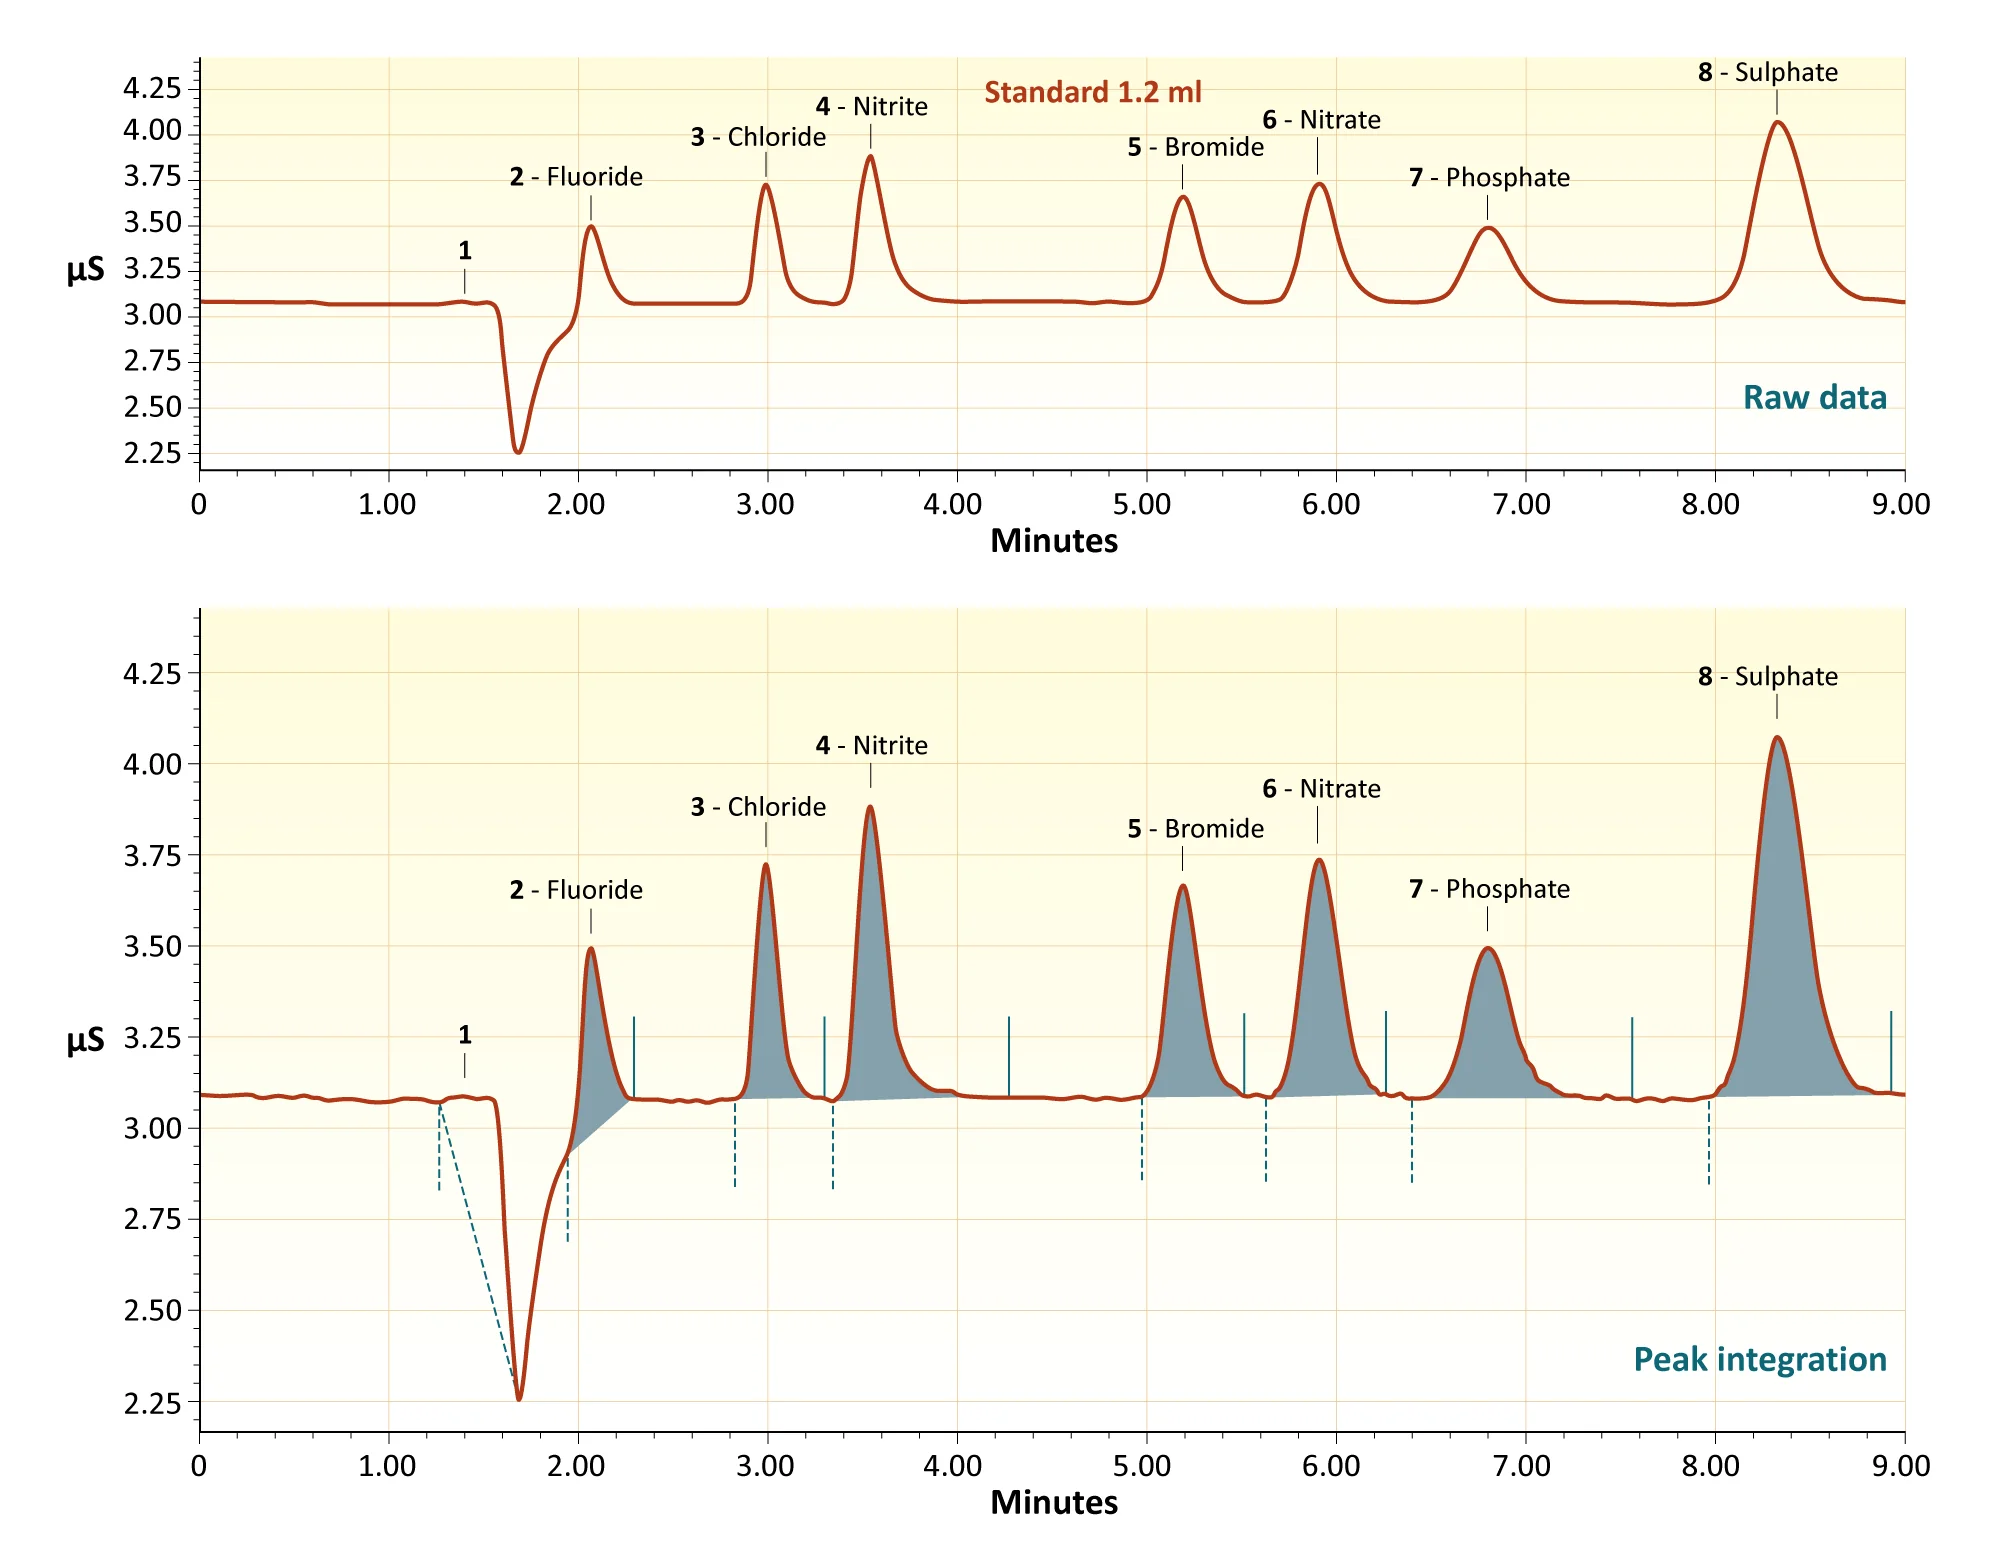
Figure: Ion chromatogram
For all the metals, cations, and anions detailed in the last two sections there are also spectrophotometric methods. These methods are based on reacting the ion in question with a chemical to produce a coloured substance which can then be analysed in a spectrophotometer. The reagents and wavelengths of the absorbance used are different for each ion of interest. The chromatographic methods tend to be more expensive and require more skill to undertake but give more precise and reliable results. The spectrophotometric methods are increasingly being integrated into automated analyses where a beer sample added to a vial is all that is required.