
Lesson 4 - Wort and Beer Analysis
This lesson looks at how to analyse the composition of wort and beer. It covers the current methods for each analysis, outlining the basics of how they are undertaken. It then explains the methods and standards used to ensure that analysis is both precise and accurate. Finally, it discusses how laboratories collaborate so that proficiency levels can be determined.
Analyses Principally on Wort
In this section we are going to discuss the analyses we undertake on wort in the lab. Some of the methods will also be applicable to ‘at line’ analyses. At line analyses are carried out in the production environment rather than in the lab. As we learned in the Quality Assurance and Quality Management lesson, there is a general trend towards more analyses being undertaken at the process level, either at line or in satellite labs.
In analysing wort we are interested in the answers to the following questions:
-
How well are the ingredients for the brew processing to make wort?
-
How well is our brewhouse performing?
-
Will the wort provide the basis for making the desired beer?
-
Does the wort have the level of nutrients required by the yeast?
The following sections show us how to answer these questions, beginning with the analysis for total nitrogen.
Total Nitrogen (TN) by the Kjeldahl method
The TN content of wort depends on the raw materials and brewing process used and on the original gravity (OG). A typical value for a wort of OG 1,040° (10 °P) would be around 700 mg/L. The TN includes ammonia, simple amines, amino acids, imino acids, and a series of derivatives of amino acids from simple peptides to complex proteins. Other nitrogenous components, including purines and vitamins, are also present. TN is mainly used to measure the nitrogen content of barley, but it is also used as an input into calorific content calculations (discussed later in this lesson).
The Kjeldahl method (also called Kjeldahl digestion) was developed by Johan Kjeldahl in 1889. To undertake the Kjeldahl method we transfer wort to a special digestion flask and heat it with concentrated sulphuric acid plus a catalyst. The nitrogenous compounds in the wort transform into ammonium sulphate. The ammonia gas is then released and bubbled through boric acid, which forms ammonium borate. The ammonium borate is titrated with a strong acid of known concentration, along with Tashiro’s indicator, to establish the concentration of ammonia. From this, we can then calculate the TN.
The test is validated by replacing wort with a solution containing a known nitrogen concentration and checking the result. Today the process is often automated.
This fascinating video shows it in action:
Note, this is for illustrative purposes only and is not a recommendation or endorsement of a particular supplier’s product.
TN by Dumas combustion
Dumas combustion involves combusting wort in a chamber in the presence of oxygen at around 1,000 °C. This produces oxides of nitrogen which we chemically reduce to nitrogen using copper-based catalysts. The other products of combustion (CO2 and water) are passed over columns for selective absorption. In another version of this method, we use chromatography to separate CO2 and oxides of nitrogen. For both methods, we use a thermal conductivity detector (discussed later) to measure the amount of nitrogen released. As with the Kjeldahl method, we calibrate the system using a standard sample of known nitrogen content and today the process is generally undertaken by machine.
Here is a video:
Note, this is for illustrative purposes only and is not a recommendation or endorsement of a particular supplier’s product.
Both analyses are also suitable for analysing TN in malt and beer.
We now know how much nitrogenous material we have in our wort. The next analyses will enable us to know how much is free amino nitrogen.
Free amino nitrogen (FAN) by wort spectrophotometry
FAN is principally produced in the mash by malt proteases. A typical range for FAN in an all malt wort of SG 1,040° (10 ºP) is 140-220 mg/L.
There are two methods for estimating FAN in wort by spectrophotometry. In the ninhydrin method, we mix wort (or beer) with ninhydrin and boil it for a set time. The yellow colour formed is measured at 570 nm using a spectrophotometer and we quantify the amount of FAN by calculation.
A spectrophotometer is a device which shines a light of a specific wavelength through a sample and measures the amount of light that passes through it. We can determine the amount of light which is absorbed by subtracting the amount measured from the amount shone on the sample.
This is of course a very basic explanation. A more detailed one can be found here:
Note, this is for illustrative purposes only and is not a recommendation or endorsement of a particular supplier’s product.
This method is referred to as an estimation because g-aminobutyric acid, ammonia, and imino acids which are present in both wort and beer stain strongly with ninhydrin and contribute to a higher result.
The other method uses 2,4,6-trinitrobenzene 1-sulphonic acid (TNBS). TNBS stains amino acids orange. We then add sodium dodecyl sulphate and hydrochloric acid to the sample and measure the absorbance at 335 nm. Both of the above methods can also be used for beer and malt.
Wort attenuation limit
The attenuation limit of wort is the point at which the yeast used to pitch the beer has exhausted the sugars and will no longer be able to ferment the wort. We can use the result of this analysis both to make decisions when managing fermentations and to manage mashing to provide the required wort fermentability. Understanding the attenuation limit of your wort is essential when making cask and bottle conditioned beer to avoid over or under carbonation.
There are two forms of the test: standard and rapid. The standard procedure involves adding 7.5 g/100 mL of compressed yeast to the wort and carrying out a stirred or shaken fermentation. The gravity or Plato of the wort at the start of the test (OG/OE) and the end of the test (FG/PE) is measured and the apparent attenuation is calculated by the following equation:

To calculate the real attenuation, we can multiply the apparent attenuation by 0.819. This adjusts the figure to take account of the fact that ethanol is less dense that water.
The rapid version of the test is identical, except that twice the amount of yeast is used. The rapid version is for indicative purposes and the limit derived from it is generally higher.
The attenuation limit is also referred to as the Limit Extract (LE).
Sugars by HPLC
We can use analysis of the sugar spectrum of wort to evaluate the effectiveness and consistency of mashing. High performance liquid chromatography (HPLC) separates the component sugars by their affinities for a silica HPLC column. We inject a sample of treated wort into the high performance liquid chromatograph. The components of wort are eluted (washed) from the HPLC column using high pressure water; a refractometer (discussed later) on the outlet of the column records and measures each sugar as they are eluted.
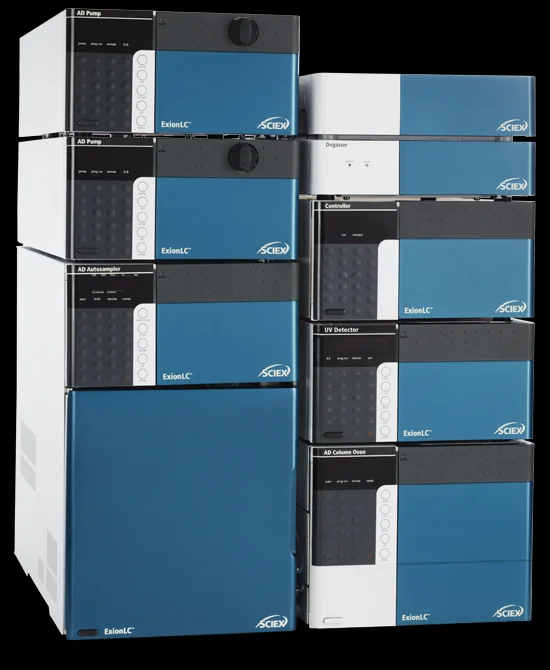
Figure: High performance liquid chromatograph
Wort sugars by colourimetry
There are several colourimetric methods available for measuring various wort sugars. In all methods, we heat the reagent with the sample and cool the mixture before the depth of colour is measured. The conditions of heating and cooling have to be adhered to very closely to obtain reliable and reproducible results. These methods have now largely been superseded by HPLC for wort and beer.
The above analyses are those undertaken principally on wort. Next, we will move on to cover analyses which we undertake on wort and beer.