
Lesson 4 - Wort and Beer Analysis
This lesson looks at how to analyse the composition of wort and beer. It covers the current methods for each analysis, outlining the basics of how they are undertaken. It then explains the methods and standards used to ensure that analysis is both precise and accurate. Finally, it discusses how laboratories collaborate so that proficiency levels can be determined.
Sampling and Accuracy
We have seen that there is a great deal of complexity in analyses. The central lab undertakes complex and business-critical analyses, as well as validating the accuracy of analysis done in line, at line, and in satellite labs throughout the brewery. This section explains what we do to make sure that the results we get are reliable. We start by looking at sampling in the right way.
Sampling
In the perfect world, any tests we undertook would leave the beer or wort intact and we could test everything we made. That way we could have complete confidence that each sample was representative of all the beer as sold. In-line analysis enables us to do this to an extent but it is not yet as accurate as lab analysis. We also need to sample to check that in-line systems are operating effectively. As we do not live in the perfect world, we need to take samples, test them, and discard them. So, we have two opposing requirements. We need to:
-
Analyse as much as possible to be sure the sample is representative
-
Analyse as little as possible so we do not waste time or materials
The size of sample will depend on the amount in the bulk that is to be sampled. For a large bulk we would take a large sample. For increasingly smaller bulks there will come a point where it should be decided if a destructive test is actually necessary. Sample frequency is also based on risk. The risk being the likelihood that the sample will be non-conforming and the severity of the outcome of the non-conformance. For example, the sampling frequency for glycol in packaged beer would be higher than for gravity in the same. And a process that produces a higher proportion of non-conforming product needs to have a higher sample size. For food-safety critical elements, like critical control points, the only option is often in-line analysis backed up by lab validation of the in-line system.
Some items that we need to analyse must be stored before we can sample them. For example, bottle conditioned beer needs to develop the appropriate level of carbonation before it is tested. Other samples need to be analysed almost immediately. Wort, for example, is very unstable so cannot be left on the side overnight before analysis. Samples from bulk must be homogenous. For example, a sample of beer from the bottom of a cylindroconical FV after 2 days on chill will have a great deal more yeast than one from the sample point 2 metres up the vessel wall. We need to factor all of these elements in when deciding how and where to sample. MEBAK, ASBC, and EBC Analytical Method Manuals give guidance on methods for sampling at all points in the production process, and in larger breweries laboratory operating procedures will be based on them. EBC recommend using ISO 2859 for designing statistically valid sample plans.
ISO 2859 can be found here:
https://www.iso.org/obp/ui/#iso:std:iso:2859:-1:ed-2:v1:en
There is also an ISO standard, ISO 3951-2:2013, which covers all sampling and can be found here:
A brewery’s determination of what sampling is required will result in a standard sampling plan, which will set out:
-
Who samples
-
How samples are taken
-
When samples are taken
-
Frequency of sampling
-
Volume sampled
-
How samples are stored
-
How samples are analysed
This will then be part of the quality manual for the brewery.
Accuracy and precision
We define accuracy as the ability of an analytical method to provide results that are equal to the true value. Accuracy is also called trueness in some literature.
Precision is a term used to describe the amount of variation in a method.
The figure below illustrates the two meanings. The process depicted is trying to hit the bullseye.
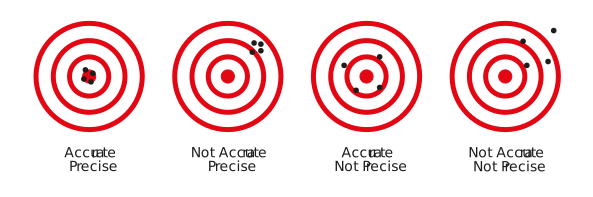
Figure: Accuracy and precision
The ‘precise and accurate’ diagram shows a well maintained, high quality, and correctly adjusted instrument used correctly by the technician.
The ‘precise but inaccurate’ diagram shows good, consistent measurements with little variation but which do not reflect the true value. This situation could be the result of a precise machine which has not been correctly zeroed or calibrated. For example, a precise lab balance which has not been tared correctly.
The ‘accurate but imprecise’ diagram shows a spread of measurements (wide variation) with a mean figure around the true value. This kind of performance could be due to a set of good quality weighing scales which are stood on an uneven surface.
The ‘imprecise and inaccurate’ diagram shows either poor technique or an instrument which is not fit for purpose.
ISO standard 5725 deals with accuracy and precision and can be found here:
Now that we have considered what we need to sample and how to describe measurement accuracy, the next section explains how we set the specifications against which we measure the samples.