
Lesson 4 - Wort and Beer Analysis
This lesson looks at how to analyse the composition of wort and beer. It covers the current methods for each analysis, outlining the basics of how they are undertaken. It then explains the methods and standards used to ensure that analysis is both precise and accurate. Finally, it discusses how laboratories collaborate so that proficiency levels can be determined.
Analyses Principally on Beer (Beer Stability)
Once in pack, beer changes over time. For most beers there will come a point in time when these changes render it unacceptable to consumers. The more stable the beer, the longer it will be before this point is reached. The analyses in this section are designed to predict the beer’s stability.
Oxidative resistance by electron paramagnetic resonance (EPR) spectroscopy
Oxidation is a key element of beer flavour becoming stale. Damage to the flavour of the beer is affected both by the amount of oxidation the beer is subject to throughout the brewing process and by the capacity of the material in the beer to resist oxidation. EPR (also known as electron spin resonance (ESR)) spectroscopy measures both. Oxidation of beer produces free radicals; EPR quantifies the amount of free radicals present as the beer is heated to 60 °C to accelerate ageing.
The free radicals are trapped using α-(4-Pyridyl 1-oxide)-N-tert-butylnitrone (POBN) and the concentration of the POBN free radical adduct is measured. Two values are obtained from the analysis: lag time, or endogenous antioxidative potential (EAP); and EPR intensity at 150 minutes (T150), or beverage antioxidative index (BAX). EAP is the time taken before an increase in free radicals is recorded and is a measure of resistance to oxidative damage provided by antioxidants in the beer. BAX is the level of free radicals after 150 minutes and is a guide to how rapidly the beer flavour will stale over time.
Beer colloidal stability tests
All beer becomes more hazy with time. The term colloidal stability refers to the ability of the beer to resist the formation of haze over time.
More information about colloidal stability and its testing can be found here: https://cdn.uclouvain.be/public/Exports%20reddot/inbr/documents/DeClerckChairMelotte.pdf
and here
https://onlinelibrary.wiley.com/doi/epdf/10.1002/j.2050-0416.2011.tb00496.x
Note, this is for illustrative purposes only and is not a recommendation or endorsement of a particular supplier’s product.
In forcing or accelerated shelf life (ASL) tests we use cooling and heating to cause a haze to form in the beer and then measure the haze. The EBC method is summarised below.
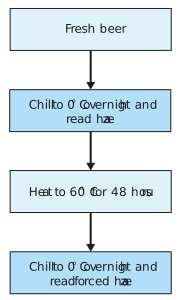
Figure: EBC accelerated test cycle
The cycle can then be repeated. We need to be certain that the ASL reflects the changes that actually occur in the beer over time so a normal shelf life (NSL) test is carried out on samples of the same beer and the results compared. The ASBC have formalised a method for selecting the ASL test which most closely matches the NSL test outcome. This is summarised in the figure below:
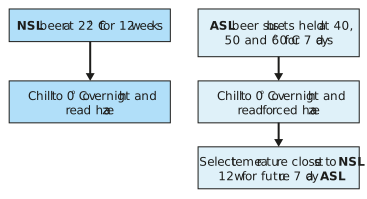
Figure: ASBC forcing test cycle determination
Haze on beer is composed of proteins and polyphenols so another approach to predict stability is to measure the increase in haze caused by the precipitation of these molecules.
Chapon alcohol chill test
In the Chapon test we add ethanol to the beer to prevent freezing and then chill to -8 °C. The chilling causes protein to precipitate and form a haze.
This video explains how to undertake the test:
Note, this is for illustrative purposes only and is not a recommendation or endorsement of a particular supplier’s product.
Sensitive protein
This test also measures the amount of protein involved in haze formation. We add a specified amount of tannic acid to a volume of beer. Tannic acid is a polyphenol and it reacts with the (sensitive) proteins which are likely to react with the polyphenols in beer with time. Measuring the haze tells us how much haze-forming (sensitive) protein is present.
Saturated ammonium sulphate precipitation limit (SASPL)
Saturated ammonium sulphate (SAS) precipitates higher molecular weight proteins to increase the haze in the beer sample. We add SAS to beer until the haze value begins to increase. This point of haze increase is the SASPL and the result is expressed in SAS mL/10 mL of sample.
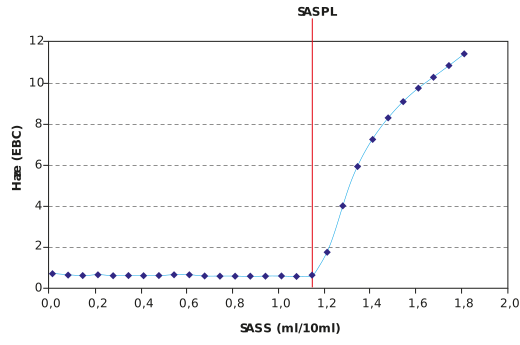
Figure: SASPL titration graph
The next tests work on the other part of the haze particle, the polyphenols.
Tannoid value
In this test, the beer is titrated with Polyvinylpyrrolidone (PVP) and the haze is measured. PVP is a similar molecule to protein and it reacts with low and medium weight polyphenols, collectively called tannoids, to form a haze. The titration proceeds until a maximum haze value is seen. This is the tannoid value and is expressed as mg PVP/100 mL.
The Tannometer from Pfeuffer performs automated versions of the following tests:
-
Tannoid content
-
Chill haze
-
Sensitive Protein
-
SASPL
HPLC
The HPLC, discussed earlier, can also be used for polyphenol measurement. The polyphenols are separated onto a Sephadex LH-20 resin column. We use UV detection to measure polyphenols as they are eluted.
We have now come to the end of our section on laboratory analysis of beer and wort. What we have covered is only a snapshot of the analyses possible. One thing to bear in mind is that lab analysis is an evolving field; new tests and equipment are coming onto the market all the time and what your lab is doing today will be markedly different in 10 years’ time. One thing which will never change in the lab is the need to be accurate and precise in analyses in order to have confidence in the results. That is what we cover next.