
Lesson 4 - Health and Safety
In this lesson we will discuss key health and safety issues within breweries. It will enable you to understand the primary legislation and how it impacts on management standards, along with occupational hazards and risks.
Risk Evaluation
A hazard itself will not necessarily cause an injury. They can be found almost everywhere and at any time, and it is impossible to address all of them. Therefore, we need to evaluate the identified ones to quantify how severe an injury or health impact they could cause, and how likely this is to occur over a set period of time.
The first step is to consider how likely it is that each hazard could cause harm. This will determine whether we need to do more to reduce the risk. Even after all precautions have been taken, some risk usually remains. What we must decide for each significant hazard is whether this remaining risk is high, medium or low.
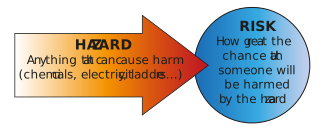
Figure: The difference between a hazard and a risk
Risk can be defined as:
Risk = severity of harm x likelihood of occurrence
There are many ways to quantify this, but one of the most common ways is to score the likelihood and consequence of each hazard and to plot these on a risk matrix.
Below is an example of a 3 x 3 risk matrix.
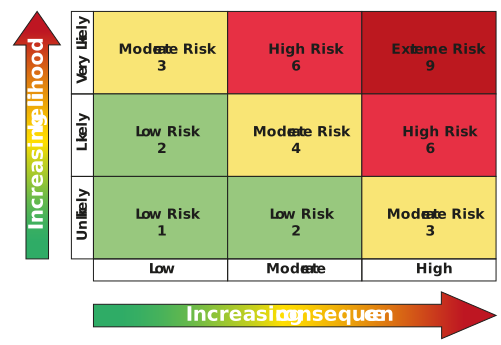
Figure: An example of a risk evaluation matrix
Plotting the risks will allow you to prioritise them more easily and to make sure the highest-ranked ones get more attention than the lowest-ranked ones. This prioritisation allows the appropriate allocation of management time and money if necessary.
Again, we must remember that this is just a tool. Far too often, risk assessment teams spend too much time on this phase. Some companies have elaborate definitions of each rating. Good advice is to keep it simple and avoid lengthy debate on the exact rating of any hazard. Generally, it will not matter if a rating of three is given when it should be a four. The purpose is simply to provide a systematic way of filtering the risks, so we do not focus too much on avoiding papercuts but rather on making sure no fingers are lost.
Risk control
Now that we have identified as many hazards as possible and evaluated which ones we need to focus on first, we can explore the different ways of deciding what to do about them.
Below is an excellent graphic published by the National Institute for Occupational Safety and Health (NIOSH) in the USA, which illustrates that we should strive to achieve certain types of control before others.
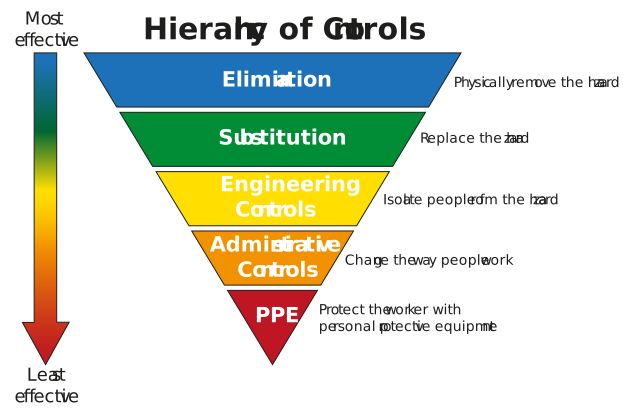
Figure: The hierarchy of risk controls
Methods of control near the top of the triangle are usually more effective and protective than those at the bottom. Following this suggested order of control will ensure the implementation of fundamentally safer systems, where the risks of illness or injury are minimised.
From the diagram, it is clear that the use of PPE is a last resort. This is because PPE does nothing to prevent the original exposure to the substance or hazard. It is purely reactive (not proactive), as a last resort, when in essence all other safety precautions have indeed already failed. This does not mean it is not important, and the correct selection, fitting, maintenance, and compliant use of PPE is vital.
Spend some time thinking about examples of how each of these controls might be applicable to specific hazards in your brewery. Give yourself 5-10 minutes to think about this, and then click ’Next’ to continue with this lesson.