
Lesson 2 - Environmental Sustainability
In this lesson we will discuss key ways to understand and improve the sustainability of brewery operations. This will include understanding the global context for sustainability, the key environmental sustainability impacts of producing beer and opportunities for improving the sustainability of beer and brewing operations.
Key Steps to Implementing an Energy Management System
Boundary
Our first step is to define the boundary of what we are trying to manage. This helps us to stay focused and to ensure we collect accurate and specific data relevant to our boundary so performance can be measured. For breweries, it is common to include all processes under the company operation.
Data needed to help define the boundary can include:
-
Site maps
-
Process flow diagrams
-
Utility drawings
-
Energy data use
-
Organisational charts
All energy consumed by the brewery should be included in your energy management framework so that you can understand total reliance on energy. Even if energy is generated on your site such as biogas generation from waste water treatment, which might be considered as ‘free energy’, the energy consumed should still be included in the total energy used. The following shows an example of what may be considered and included in a brewery energy management system boundary.
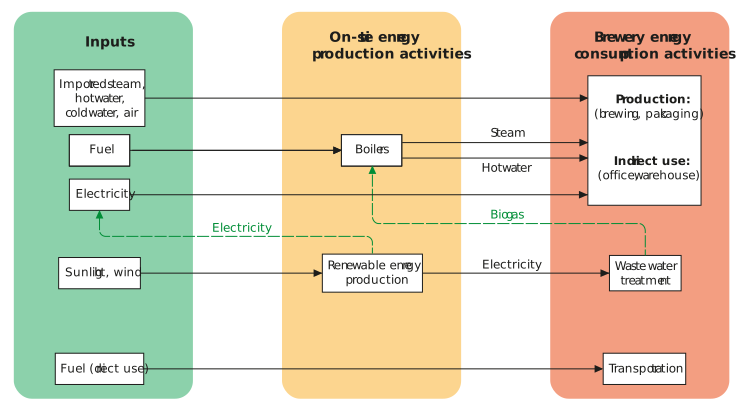
Figure: Typical boundary for a brewery energy management system
Baselining
The next step is to develop a baseline of energy use to understand where you are starting from. To do this we need to understand what energy is being used on-site, starting at the total site level, and drilling down in greater detail where this is available. Baseline data can be generated from different sources and may include the following, listed from most accurate to least accurate:
-
Direct readings from calibrated meters
-
Utility bill
-
Mass balance
-
Judgements
Where data accuracy is poor, judgements can give us a good place to start and work can then be done to improve data accuracy where it makes sense to support improved management of energy.
Metering
The phrase ‘you can’t manage what you don’t measure’ is very applicable to energy management. Utility bills can give us the total energy spend and use but they do not contain sufficient detail or regularity of information to help us understand site energy use to make the best management decisions. The right metering of energy helps us to understand real-time consumption and its relationship to production demands. More granular data allows greater opportunities to analyse trends and identify spikes in use, as well as the transfer of measured energy costs into the user cost centre.
Metering may start at the whole site level, through different logical groupings of equipment right down to specific equipment level. The image below shows logical groupings according to ISA 88, which addresses batch process control and a design philosophy for describing equipment and procedures.
In addition to regulatory reporting requirements, several factors determine optimal metering levels. Investing in additional metering on energy intensive areas will give us more granular data to analyse and control energy use. Additional metering investments can often be justified, and prioritised, by the cost savings that better control of energy use can create. Once the most straightforward and achievable tasks for the largest energy users have been controlled and optimised, the next biggest energy consuming area can be undertaken.
The method of gathering data and the frequency of meter reading may vary. Meters are available that will transmit their reading automatically on a half-hourly basis. These are used increasingly for more automated, cloud-based management systems that support short interval control. It can also sometimes be appropriate to use temporary meters to enable critical monitoring points to be identified.
Managing energy in real time has the major benefit of being able to take immediate action over an abnormal use. This can be arranged by having alarm levels which, when breached, can send a message to, for example, a mobile phone or phones.
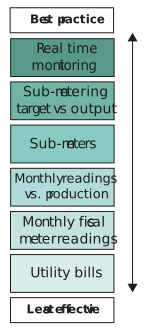
Figure: Standard terminology of the hierarchy of a production plant and classification of the appropriate metering infrastructure according to ISA 88
Key performance indicators
The next step is to develop the right key performance indicators (KPIs) to track performance and monitor what is important. This might seem simple and obvious, but it is worth thinking about what to measure, when to measure it and who will see it.
Ensure that KPIs
-
Can be measured with appropriate frequency, such as hourly, daily and weekly.
-
Resonate with the brewery management and are connected to the objectives of the brewery.
-
Are easy to understand, and act on.
-
Are shared by those who can act on them, i.e. the people that use the energy.
KPI performance data should be reported to, and regularly reviewed by energy users and other people who can influence energy use on a regular basis. They can be used to analyse and track trends, and compare against expected performance or calculated standards. Variances can be reported and investigated.
As mentioned in metering, energy management systems are increasingly being supported by cloud-based software that supports almost real-time reporting of energy use (depending on the frequency automated metering data is collected). These systems can help users to track performance against KPIs and expected performance. Where performance is outside of expected norms, the systems can flag or alarm these variations enabling fast investigation and corrective action.
Common KPIs for energy management are listed in the table below:
Table: KPIs that can be used in energy and carbon management
|
Name |
Description |
KPI |
|
Energy consumption |
How much energy is consumed in a given period |
kWh / time |
|
Energy efficiency |
Ratio of useful work delivered to energy consumed to accomplish a certain task |
kW/hL or MJ/hL production
|
|
Energy intensity index |
Ratio of actual energy consumed to what would have been expected in the absence of efficiency measures |
Ratio (e.g. 0.92 representing 8% savings) |
|
Avoided energy use |
Cumulative energy saved over a period |
x kWh in a year |
|
Peak energy demand |
The maximum energy usage in a given period |
x kW |
|
Total energy cost
|
Energy spend over a given period |
$ / time |
|
Energy cost efficiency |
Energy costs per unit of production |
$ / hL |
|
Percent of renewable energy |
Amount of renewable energy sources used as a proportion of total energy use |
% |
|
Carbon intensity |
Carbon emission per unit of production |
CO2e / hL Production |
Benchmarking
Benchmarking against other breweries or specific processes can help us to understand expected performance better, help us to create new energy reduction projects, and motivate people involved in energy management.
Benchmarking may be internal if there are multiple breweries within a company, or external, using published data or other sites you know and where you can ask questions and share information. Benchmarking may also be based on other industries that have a more stringent compliance regulations, such as pharmaceuticals.
For benchmarking data to be meaningful and comparable, establishing boundaries, common definitions and a set of guidelines should be discussed and agreed, so that it is clear what will be included and excluded, and material differences in drivers of performance.
Goals and targets
With the data generated from the system so far, setting energy and carbon emission goals and targets can help us develop a longer-term vision and improve performance beyond business-as-usual.
Goal vs. Target?
A goal is a long-term vision of an organisation’s energy management programme, often tied to internal policy or strategy. Goals can be influenced by operational, financial or legal variables.
A target is a detailed, measurable and incremental step aligned to facilitate achieving a defined goal.
Developing a goal for energy and/or carbon could be longer-term and quite ambitious. Goals might have to be developed from the bottom-up, knowing exactly how much and where energy can be saved in the brewery, to calculate the final energy savings that are needed. Alternatively, the process could be more top-down, based on sustainability ambitions or in response to legislation, such as the long-term country targets on carbon reduction. It is important to note that there may be an element of not knowing exactly how every part will be achieved. The success of different approaches to goal setting will be based on the process and culture in your organisation.
Targeting involves setting levels for the KPIs you have chosen to monitor that can be realistically achieved over a set period. They are typically based on data of past performance, with incremental or planned improvements built-in, but can also be based on benchmarks of best practice. In the brewing industry targets are often based on indexed (normalised) metrics, for example, a kWh of energy per hL. However, absolute goals and targets are important to consider when creating sustainability goals where reducing total carbon emissions are necessary.
As with the KPI discussion, energy users need to share responsibility for goals and targets if they are to be successful. With a system that monitors energy and carbon KPIs and targets, it is possible to produce and analyse trends and make informed decisions to help to improve performance.
The International Organisation for Standardisation, ISO 50001, also provides further guidelines on energy management systems. In some countries having a site energy management system certified to this standard may have government incentives: