
Lesson 6 - Sensory Analysis
This lesson deals with the sensory analysis of beer. It details how to set up the elements of a sensory panel, such as panel selection, training, and the design of the sensory facilities, and then covers how to run the panel and collect the results. It discusses the various types of sensory test and their benefits before going on to cover the use of statistics to convert sensory data into information about the sensory quality of beer. Finally, it looks at the presentation of results from sensory tests and lists key flavour compounds in beer.
Other Sensory Tests
This section looks at tests which do not fit into descriptive or difference test categories, including one which is almost exclusive to the brewing industry.
Ranking tests
Earlier we learned that difference tests answered the question of whether there was a difference between certain beers. Ranking tests answer the following question:
Where does this beer stand in a range of beers for this attribute?
Ranking tests involve either ranking samples according to the level of a preselected criterion (bitterness, freshness, fullness, etc.) or ranking the samples based on preference. Although the results will give a probability that samples vary in terms of the specified attribute, they do not give a magnitude of that variation. For example, here are test results ranking a set of beers for the attribute ‘bitter palate’:
Sample a = 6 IBU
Sample b = 8 IBU
Sample c = 10 IBU
Sample d = 84 IBU
The result of the test only tells us that sample d is the most bitter; not how many orders of magnitude more bitter it is than all the other samples.
Ranking tests are carried out on three to six samples and are useful for:
• Screening samples when planning a more precise assessment such as descriptive analysis.
• Classifying a set of samples.
• Determining consumer preference ranking.
• Training assessors in key attributes.
Ranking tests are quick to perform and require at least five assessors with at least one being a sensory expert. When used for consumer testing, greater than 100 assessors are required.
Samples are presented at random, but assessors must make a provisional order on the basis of first impressions and then work towards the definitive rank. Assessors are instructed to take small sips of samples which are easy to place in rank. Once this is done, they take longer sips of samples which are closer together in terms of the criterion being considered. This minimises sensory fatigue. If assessors are unable to separate two samples with regard to the assessed attribute (known as tied rank), they are asked to record the samples they were unable to rank in a separate section of the assessment form.
Trueness-to-type (TTT) test
TTT analysis is almost exclusive to the brewing industry. In trueness-to-type we assess the beer with reference to a model flavour profile. The result is a numerical value for overall flavour quality.
The analysis needs to be completed by 10-20 assessors who are fully trained and screened and who are very familiar with the beer being assessed. A maximum of four beers per panel session is usual. In the first stage of TTT we assess around eight positive attributes against a scale, giving the highest mark to the best match to the standard flavour and progressively lower marks as the attribute deviates from the standard. We then make a sum of the positive marks which is called A. The beer is then assessed for the presence of negative attributes with zero given for their absence and higher marks given for increasing presence of the attributes. Again, we sum these marks and the total is called B. We calculate the overall score by subtracting B from A, dividing by the maximum possible score, and multiplying by 100 to express the score as a percentage. A mean score is calculated from the panellists’ marks for each beer. A minimum level is set for acceptance of the product. A high scoring example is used to routinely remind the panel of what the ideal version of the beer is. It is also good practice to have another panel regularly perform a TTT test to correct any drift in the model of the ideal beer. An example of a TTT form is shown below.
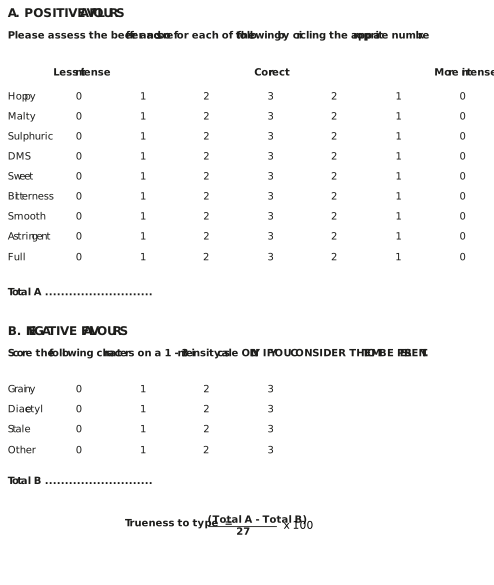
Figure: Trueness-to-type form
Threshold test
There are three types of flavour threshold for assessing the components of flavour in beer, which are:
-
Stimulus threshold: the level at which we notice a change in flavour.
-
Recognition threshold: the level where the substance can be detected and described.
-
Difference threshold: the level at which a change in concentration can be perceived.
We can use threshold tests to determine each of these levels. In this section, we focus on the second of these levels, namely recognition of the lowest concentration of a substance added to beer that can be detected as odour or taste.
In the test, we present the assessors with six sets of triangle samples of beer: two unspiked standards and one test sample that has a flavour compound added in increasing concentrations. We increase the concentration by a factor of two. The spiked samples should be arranged such that they occupy a different position in the order of the three samples for each increasingly concentrated sample. An example of the order is show below, with the increasing concentration in the test sample shown as x2, x4, etc.
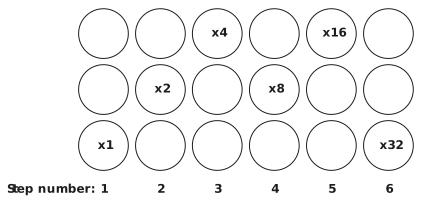
Figure: Order of presentation for threshold test
Assessors are asked to identify the test sample from each of the three samples. Assessors should not carry on sampling the sets after they are confident they have identified the test sample to prevent over exposure. The figure below shows a typical threshold form.
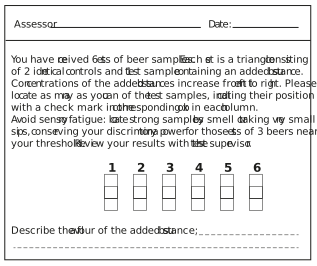
Figure: Threshold test form
Before the test, a similar protocol is followed but this time using threefold increases in concentration; this enables us to estimate the approximate threshold and hence the concentration on which to base the actual test.
We can make an individual best estimate of threshold for each assessor by finding the geometric mean of their highest missed concentration and the next highest value. The threshold value for the whole panel is calculated from the individual thresholds.
Geometric mean is explained here:
Threshold tests are completed by around 16 assessors. They are useful in determining the threshold level of a flavour component and for learning whether that substance is present in the beer tests and what contribution it makes to the overall flavour of that beer.
We now know the main sensory tests that are available for most sensory problems and quality assurance purposes. Next, we discover what to do with the results from these tests to turn the raw data into useable information.