
Lesson 6 - Sensory Analysis
This lesson deals with the sensory analysis of beer. It details how to set up the elements of a sensory panel, such as panel selection, training, and the design of the sensory facilities, and then covers how to run the panel and collect the results. It discusses the various types of sensory test and their benefits before going on to cover the use of statistics to convert sensory data into information about the sensory quality of beer. Finally, it looks at the presentation of results from sensory tests and lists key flavour compounds in beer.
The Triangle test
The Triangle, or sometimes Triangular, test is one of the most commonly used difference tests in breweries. It is most useful for establishing that slight differences exist between beers. We can use it to check if changes in the brewing process – such as the new season’s malt or a change in hop batch – have led to a change in the taste of the beer. The Triangle test is also useful for monitoring panellist performance.
The recommended number of panellists for the Triangle test is between 18 and 30. If untrained tasters are used the number should be at least 25 while below 20 is adequate for a panel of trained tasters. These kinds of numbers make the test impractical for smaller breweries but, as we learned earlier, we should avoid the temptation to simply repeat the test several times with fewer tasters as the results will be inaccurate due to learned responses.
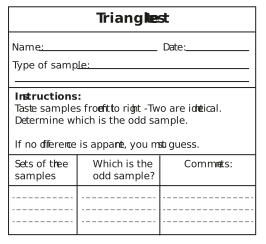
Figure: Triangle test form
We now look at how to undertake the test. The assessors are presented with three sample glasses which they are asked to taste in a defined order. There are six possible orders of samples and these orders of presentation are equally spread across the tasting panel. For example, here are the samples given to the first six assessors:
Panellist 1 - AAB
Panellist 2 - ABA
Panellist 3 - BAA
Panellist 4 - BBA
Panellist 5 - ABB
Panellist 6 – BAB
It is important to use this presentation order as there is a natural tendency to say the middle sample in the triangle is the odd one out. Presenting samples in this order means the middle sample varies from assessor to assessor. The assessors are asked to pick the odd one out after tasting the three samples.
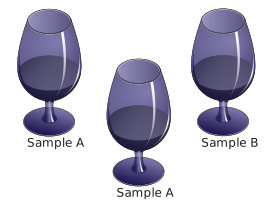
Figure: Glasses for the Triangle test
Selection is made on a forced-choice basis i.e. the assessors do not have the option of saying they are all the same. The probability of the assessor guessing the odd one out on the basis of luck is one in three and is factored into the statistical analysis of the data. The Triangle test should not be used for determining preferences between samples.