
Maths for Diploma Studies
This lesson is designed to provide the background knowledge in maths required to study CIBD Diplomas successfully. It will describe the basics of maths before detailing the more complex concepts encountered in CIBD lessons. Techniques for working with numbers, equations, and units will also be described.
Interpolation
Interpolation sounds a bit like one of those words marketing departments make up like ideation, story-scaping or advertainment, but it is actually a useful tool for finding the right numbers.
Interpolation is the way of estimating an unknown number by calculation. The calculation is based on what we know. We can see what we are trying to do in the figure below. We are calculating the value of the blue dot based on the value of the red dots.
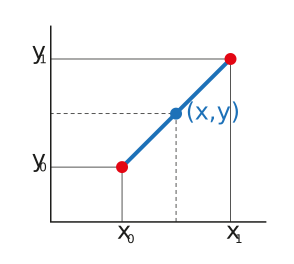
Figure: Interpolation
What we will discuss here only works for linear relationships. If we try to do it for nonlinear relationships, we won’t get the correct figure. A rather extreme example of this is shown below, but you can see our blue dot is miles out.
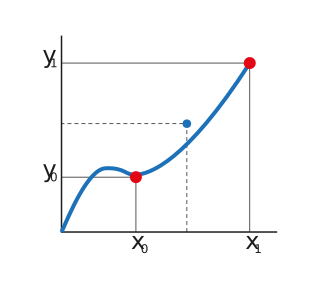
Figure: Linear interpolation for nonlinear relationship
Let’s look at an example. The table below shows cans per minute (cpm) produced by a filler through its range of speeds. It’s a very fast filler!
Table: Cans per minute at a range of speeds
|
Rating |
Cans per minute |
|
0 |
0 |
|
10 |
3,240 |
|
20 |
6,480 |
|
30 |
9,720 |
|
40 |
12,960 |
|
50 |
16,200 |
|
60 |
19,440 |
|
70 |
22,680 |
|
80 |
25,920 |
|
90 |
29,160 |
|
100 |
32,400 |
|
110 |
35,640 |
And here’s a graph of the same data showing that it is linear.
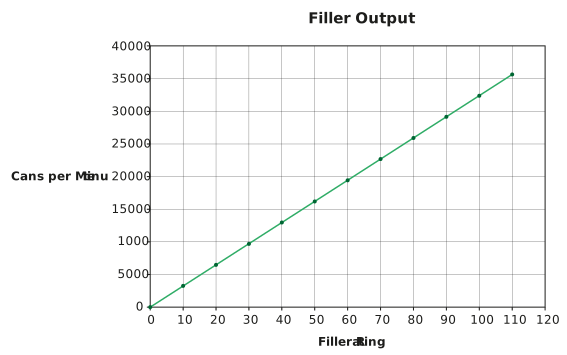
Figure: Graph of cans per minute versus filler rate
Now let’s use an example. There is a problem with the transport of finished goods so we can’t produce more than 15,500 cans per minute (cpm) without the warehouse filling up and the line needing to stop. We need to work out what rate this equates to so we can set our filler speed. This is where interpolation comes in.
We know that at a rating of 40 we get 12,960 cans per minute, and at 50 we get 16,200 cans per minute, so the required speed is going to be somewhere in between. Interpolation is based on the difference between the rating that is equal to the difference in the rate.
The difference in cans per minute for a difference in rate between 40 and 50 is:

The difference between 40 and 50 is:

So the difference in cans per minute for each single unit change in rate is:

The difference between 12,960 cans per minute at a filler rate of 40 and our maximum allowable run rate of 15,500 cans per hour is:

So if we find out what proportion the difference between 12,960 and 15,500 is of the difference in cans per minute between for each unit of the filler rate, that will tell us how many units faster than 40 we need to go to achieve 15,500. To do this, we divide the difference by the output per unit rate:

We now need to add this to 40 to get the target rating:

We can check that we are indeed expert mathematicians by plotting the new data point on our graph below, and as it’s bang on the line, we are looking good!
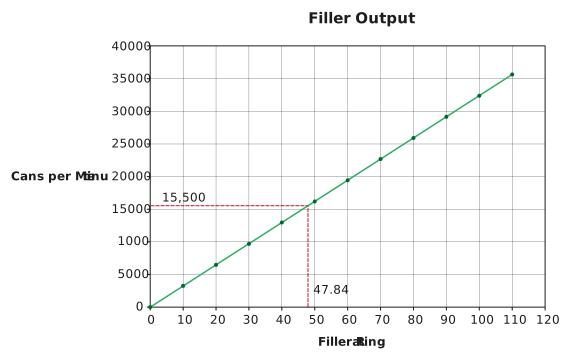
Figure: Verifying our interpolation
As by now, we have developed a serious passion for equations, we can also employ one to achieve this. Here’s the algebraic representation of what we have just done.

So in our example:
 = The required filler rating
 = The filler rating corresponding to the nearest known output below the required output (40)
 = The filler rating corresponding to the nearest known output above the required output (50)
 = The required output (15,500 cans per minute or cpm)
 = The output corresponding to the nearest known rating below the required rating (12,960 cpm)
 = The output corresponding to the nearest known rating below the required rating (16,200 cpm)
Let’s input our figures


The power of equations! If we know the relationship of the data (for example, logarithmic or exponential), we can also produce an interpolation equation to allow us to interpolate an unknown data point from nonlinear data. You’ll be delighted to know that you won’t need these for your CIBD studies.