Lesson 2 - Wort Separation Principles
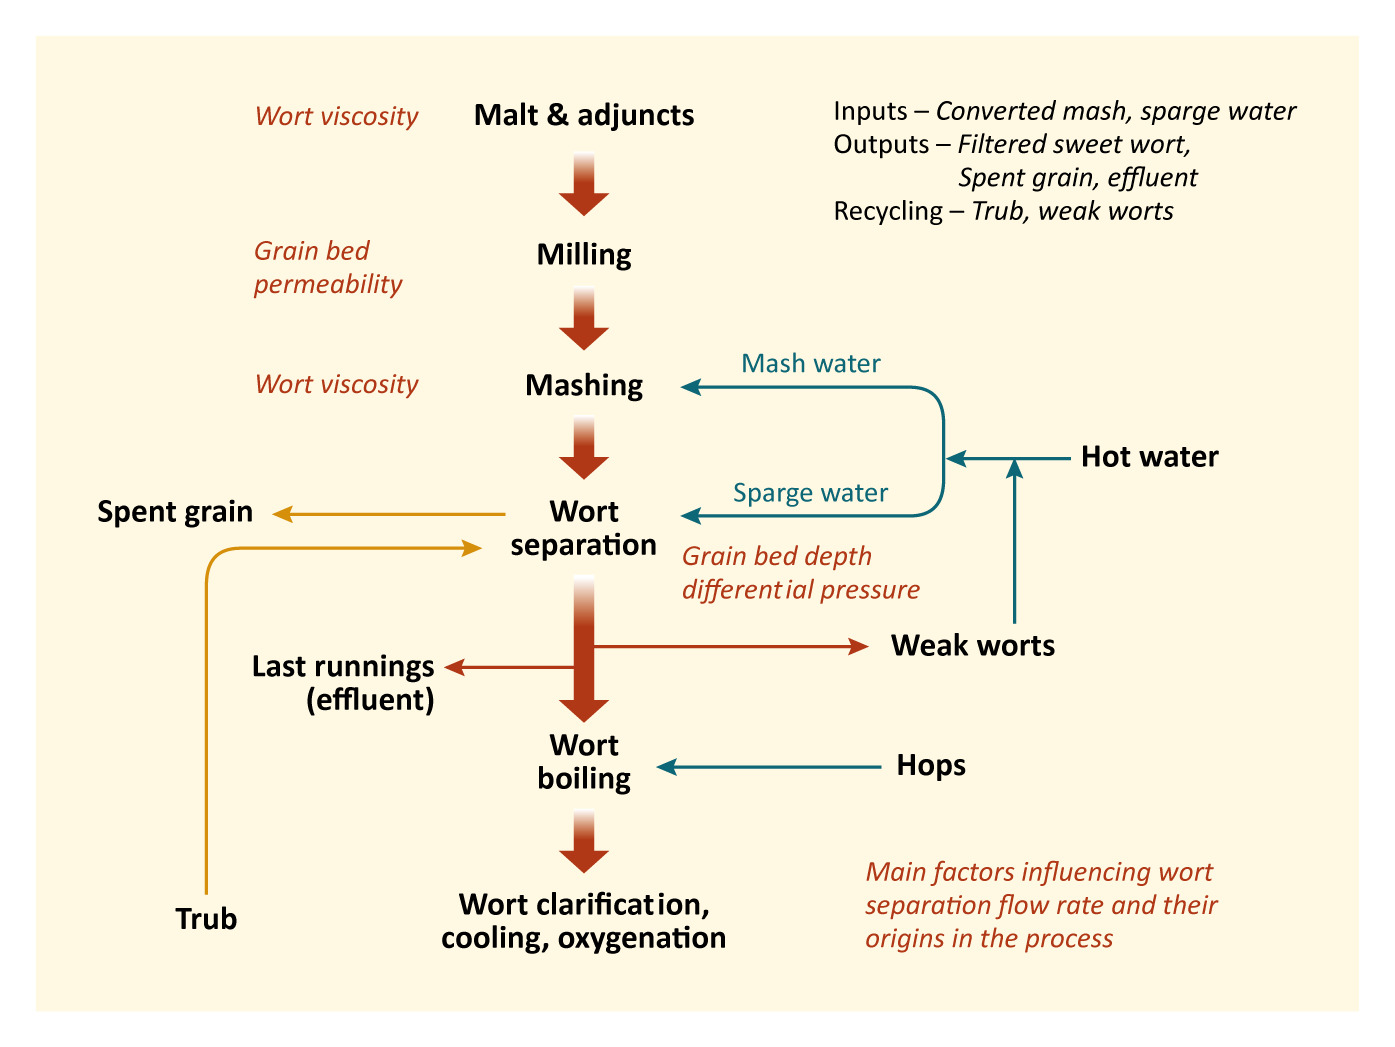
This lesson deals with the principles of wort separation. Before wort separation, we have completed mash conversion. We will now need to separate the liquid wort from insoluble material. This is mainly the husks from the malt, known as spent grain. We will review the reasons why filtered wort must be clear, and how this affects wort quality. We will examine how the all-important grain filter bed is formed differently, by each of the three most common mash separation devices. These devices are: the lauter tun, the mash filter and the mash tun. We will investigate a typical wort collection profile, which ends with the removal of the spent grain.
Darcy’s Law describes filtration flow rate. We will assess both the variables involved, and what influences them. We will finally use Darcy’s Law to predict the relative flow rates of the three mash separation devices.