
Lesson 6 - Refrigeration Theory and Cycle
This lesson explains the concepts of refrigeration. It describes the cycle that is utilised in all refrigeration systems and identifies where such systems are found in a brewery.
Worked Example - COP
Find the COP of a refrigeration plant operating with ammonia, when the evaporator temperature is -15°C, and the condenser temperature is 30°C. What is the effect of raising the evaporator temperature to -10°C and reducing the temperature to 25°C?
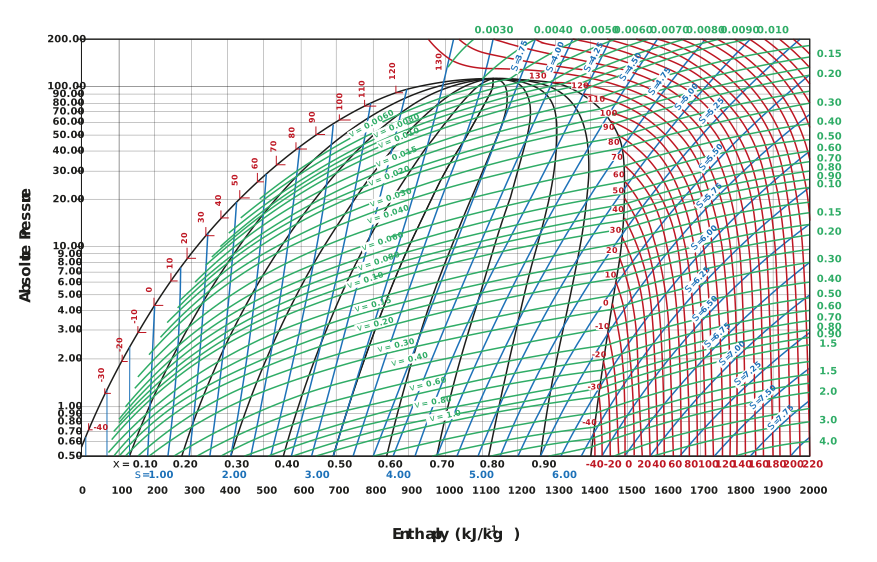
Figure: Mollier diagram for ammonia
To solve this problem, we will first need to know the enthalpy change during evaporation, and the enthalpy change during compression. To determine that, we must also know the operating conditions. First, we will outline the process with the initial conditions on the Mollier diagram (please refer to the chart above).
Remember, 1 bar = 100 kPa, and the pressures on the Mollier diagram are absolute pressures.
Let’s start at the exit of the evaporator. We can put our first point on the saturated vapour line at a temperature of -15°C. Let’s call that point 1. Notice that this temperature corresponds to a pressure of 2.5 bar a.
We also know that at the exit of the condenser, we will be at a saturated liquid temperature of 30°C. Let’s call that point 3. Notice that this temperature corresponds to a pressure of about 13 bar a.
Now that we know what two operating pressures we will be working in between 2.5-13 bar a:
The next step is to determine point 2, the exit conditions of the compressor. The compressor will increase the pressure from 2.5 bar a to 13 bar a, and it does so at constant entropy. So, we can follow the blue constant entropy lines from point 1, up to a pressure of 13 bar a.
Lastly, the expansion valve decreases the pressure from 13 bar a, back down to 2.5 bar a, and it does so at constant enthalpy. We can then mark point 4 and complete the circuit.
We can now look at the bottom of the Mollier chart and determine the enthalpy h1, h2, and h3.
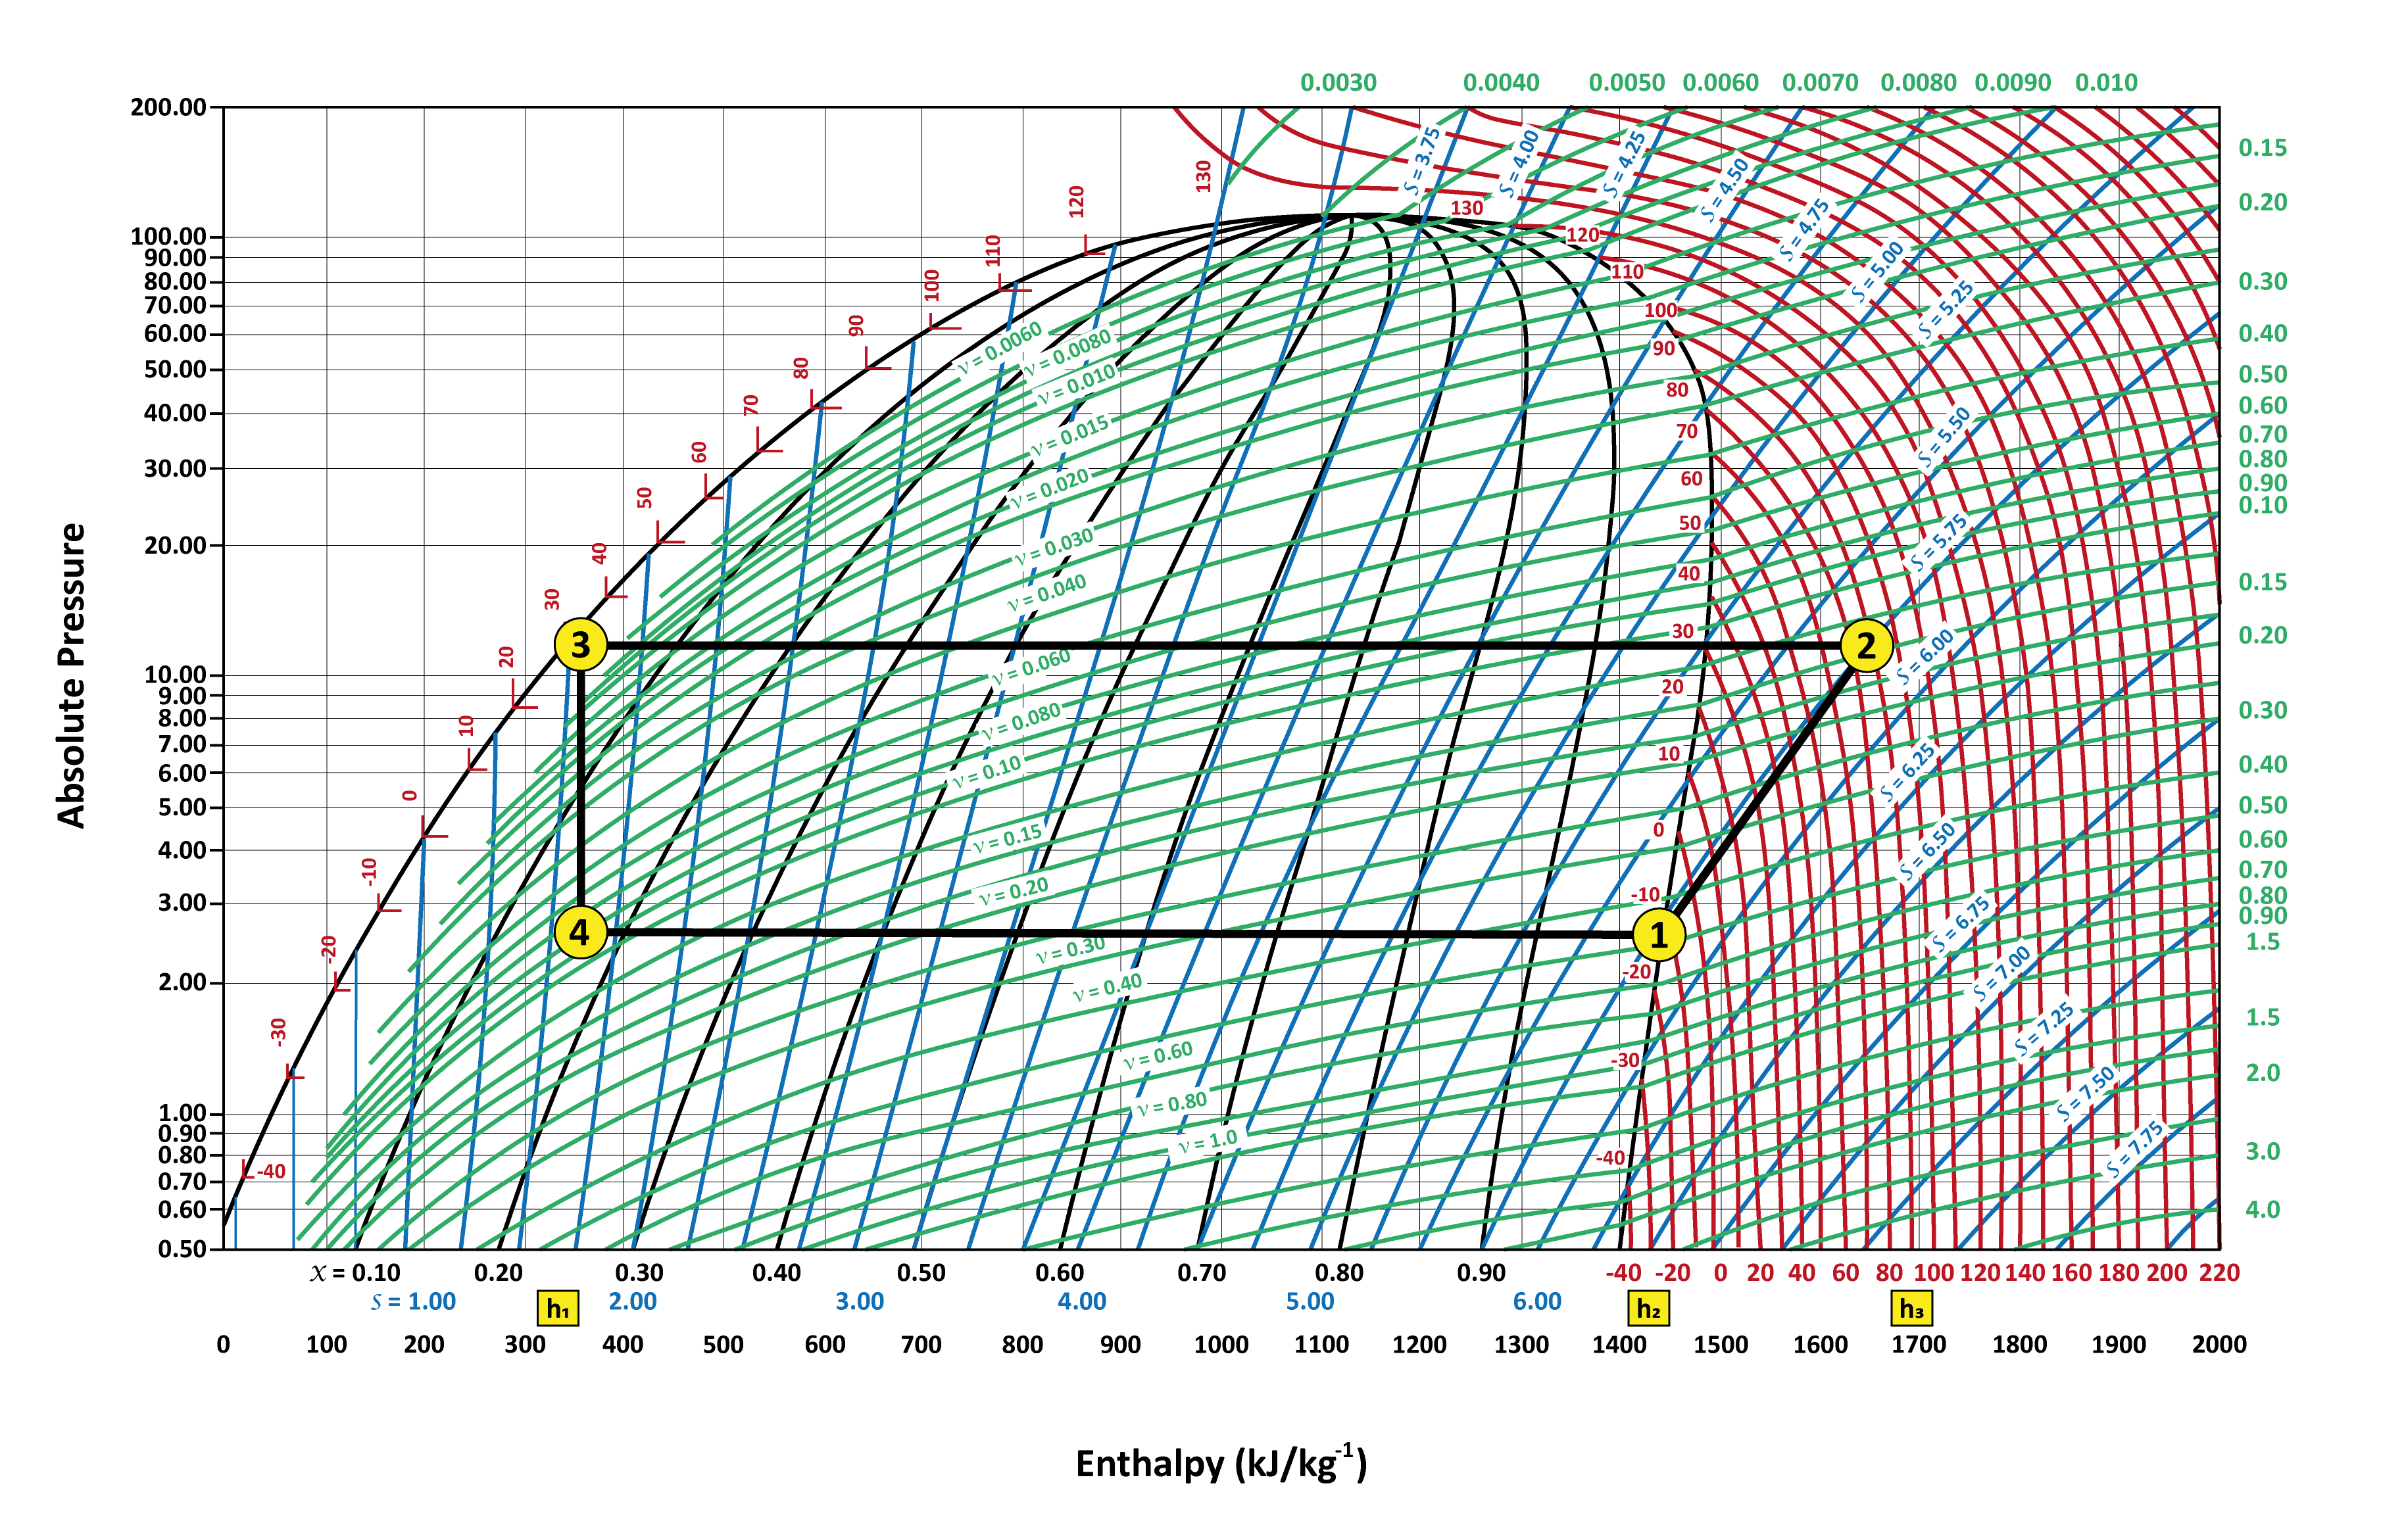
Figure: Mollier chart for ammonia with refrigeration process
Next, we can pull the values from the chart and calculate.
The COP for the original conditions will be:

h1 is the specific enthalpy of the saturated liquid at 30°C, which is around 310 kj kg-1.
h2 is the specific enthalpy of saturated vapour at -15°C, which is around 1,450 kj kg-1.
h3 is the specific enthalpy at the exit of the compressor, which is around 1,680 kj kg-1.
Entering our values, we then have:

Using the same process as before, and the new conditions, we can use the following values for h1, h2, and h3.
h1 is the specific enthalpy of the saturated liquid at 25°C, which is around 300 kj kg-1.
h2 is the specific enthalpy of saturated vapour at -10°C, which is around 1,460 kj kg-1.
h3 is the specific enthalpy at the exit of the compressor, which is around 1,640 kj kg-1.
Entering our values, we then have:

In practice, the performance of a compressor is much less than these values. Mechanical friction can account for 25% of the compressor power. Added to this, there is the friction of the gas as it passes through the compressor. Typical values for the conditions shown in the example are 3.38 and 4.68, respectively.