
Lesson 6 - Refrigeration Theory and Cycle
This lesson explains the concepts of refrigeration. It describes the cycle that is utilised in all refrigeration systems and identifies where such systems are found in a brewery.
Coefficient of Performance
Now that you understand the refrigeration cycle and how to determine the energy being transferred within the system, we can now introduce a means of determining the efficiency of a cooling system. The coefficient of performance (COP) is a measure of the efficiency of a cooling process.
Moreover, it is essentially the ratio of energy output to energy input. As you may recall, the overall aim of the refrigeration cycle is to remove heat.
-
The total output of energy that we get is the amount of cooling that takes place. This is equivalent to the cooling load rate of the evaporator, Qe.
-
The total input of energy in the form of work that is required by the compressor to compress the refrigerant is expressed as Qw.
Therefore, the COP for a refrigeration system is the ratio of the cooling load rate, (Qe), to the work done by the compressor, (Qw). Mathematically, this looks like:

If we recall the equations that we used for the cooling load rate, and the work done by the compressor, we can then write:

Let’s re-examine the Mollier diagram below. We can see that the cooling load rate of the evaporator is the equivalent to the specific enthalpy difference of the refrigerant as a saturated vapour, and the specific enthalpy after the expansion valve. Since it is a mixture of liquid and vapour, it is difficult to know the exact state after the valve. Therefore, when we assume that the valve operates at constant enthalpy, we can use the specific enthalpy of the refrigerant as a saturated liquid at the condensation pressure. Moreover, we use the conditions at point (d) to determine the enthalpy of point (e).
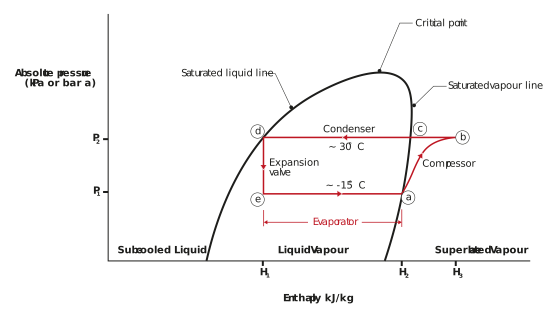
Figure: Illustration of an OVC cycle on a Mollier diagram
Typical values for COP range from between 3 to 5, but it depends on the operating conditions.
We want to maximise the COP with as little work as possible. That is, we want the largest cooling load rate possible, while doing the smallest amount of work.
On the next page we will use an example to calculate the COP using an actual Mollier diagram for ammonia. The Mollier diagram for ammonia is below. If you need a refresher on how to read a Mollier diagram, please refer to the Steam Theory lesson from within this unit.