
Lesson 4 - Gas Transfer
This lesson focuses on transferring gases into and out of solution. It looks in particular at carbon dioxide dissolution in water and beer, and explores how to manipulate pressure, temperature, and gas composition to influence the saturated gas concentration (as well as the rate of gas transfer). It also looks at some tabulated data that are widely used in the industry. The lesson concludes by describing gas transfer technology.
Practical Gas Solubility
From the previous examples, you will have seen that applying Henry’s law is quite an involved process. In practice, an additional complexity is the lack of a readily available source of Henry’s law constants for brewery gases in water and beer of differing specifications.
As carbon dioxide and water/beer are probably the most commonly considered systems in a brewery, to examine their solubility behaviours there are a couple of practical alternatives to the explicit use of Henry’s law and these include:
-
Tabulated solubility data
-
Solubility equations
Let’s look at each of these in turn.
Tabulated solubility
A search of the Internet will bring up several sets of tables (and associated equations) for CO2-water/beer solubility data, including those from MBAA, ASBC, researchers, and equipment suppliers.
Let’s quickly look at how to use a table from the ASBC.
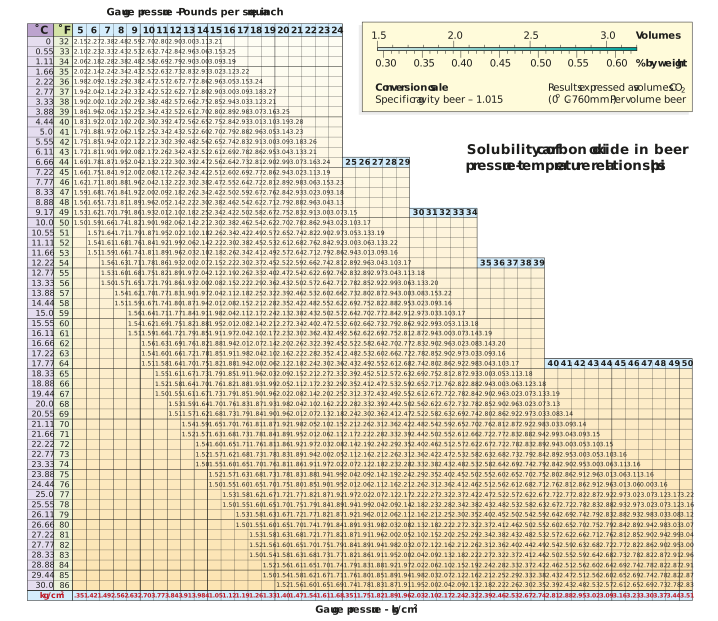
Figure: ASBC chart of CO2 solubility in beer
The figure above shows the equilibrium solubility in volumes of CO2 per volume of beer for a beer of specific gravity 1.015. Unfortunately, the units on the primary axes are not SI, but metric temperature (°C) and pressure (kg/cm2) values appear on the far left and bottom columns of the chart, respectively.
As we know, 1 kg/cm2 is very close to 1 bar (actually 0.981 bar or 98.1 kPa).
Let’s look at an example of using this chart.
What is the equilibrium solubility of CO2 in beer when it is subject to a top (i.e. gauge) pressure of 1.33 kg/cm2 (1.30 bar g) at a temperature of 5°C?
Using the chart is quite straightforward, we read the gauge pressure along the bottom (or top if in psi) and the temperature down the left-hand side and the equilibrium solubility is found as the position where they intersect. This shown in the figure below. The CO2 equilibrium solubility is 3.05 v/v CO2.
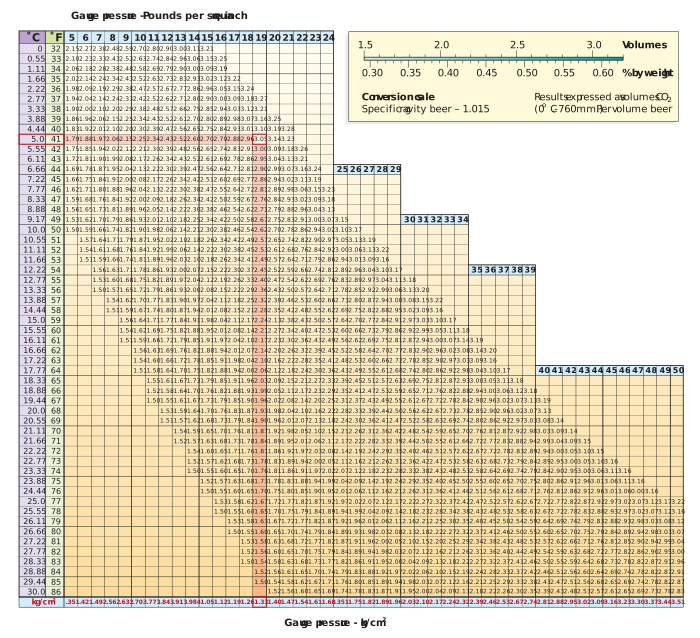
Figure: Use of ASBC chart to estimate CO2 solubility in beer
For comparison, see below for a similar table illustrating CO2 solubility in water.
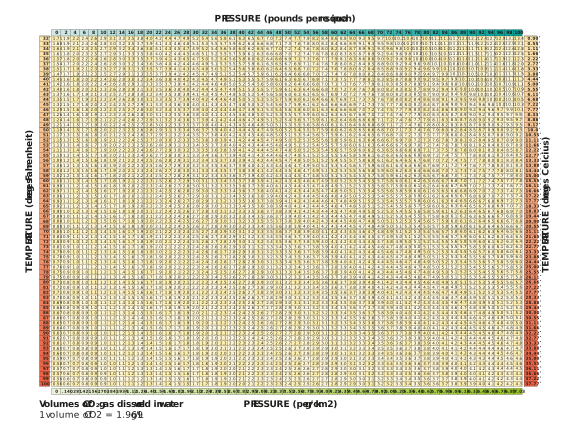
Figure: ASBC chart of CO2 solubility in water
Solubility equations
There have been a number of attempts at producing equations, which are not based on Henry’s law, to model CO2 solubility data. Most likely, these were equations which were statistically fitted to experimental data, but the detail of this process and the experimental data used are difficult to explicitly locate. An example of one equation is given below and is attributed to a man called S.R. Holle, so it is referred to as the Holle correlation:

It is important to note that there is no documented parameter range, i.e. P or T, of applicability for this equation, so use it with caution. It probably applies only to the pressure and temperature ranges found in brewing processes.
Now, take note of the unusual units i.e. non-SI. PPSIg is the gauge partial pressure in pounds per square inch; TF is the temperature in Fahrenheit; and, last but not least, is the solubility value of CO2 dissolved in beer, where the units are (are you ready for this?) volumes of gaseous CO2 per volume of beer at standard temperature and pressure (STP). As this unit of CO2 dissolved concentration is almost an industry standard, let’s just quickly consider it in a little detail.
Using Holle’s correlation, determine the required CO2 pressure (bar g) to achieve a saturation concentration of 2 v/v (at STP) and 2°C.
Restating Holle’s correlation:
Now, take note of the unusual units i.e. non-SI. PPSIg is the gauge partial pressure in pounds per square inch; TF is the temperature in Fahrenheit.
So, let’s convert the temperature from Celsius to Fahrenheit (if you are not familiar with this conversion you will find information on this process online or in text books – the boiling point in Fahrenheit is 212°F and the freezing point is 32°F:

Rearranging the Holle correlation for PPSIg:


Converting this into bar g:
