
Lesson 2 - Steam Theory
This lesson introduces steam as a heating medium. It outlines its uses, benefits, and various properties. It also explains the difference between utility and culinary (clean) steam, as well as the production methods employed for both.
Mollier Diagram and Steam Tables
The phase diagram that we saw on the previous page will help us to determine the phase of a substance under certain conditions, but it does not provide any values of latent heat or specific enthalpy. To gather this thermodynamic data, we need to consult steam tables and/or a Mollier diagram.
Steam tables have exact values, while Mollier diagrams are good when making visual and rough estimates.
For a given temperature and pressure, steam tables provide the specific enthalpy (energy), amongst other data (which we will discuss later).
Before we look more deeply into steam tables, let’s first learn how a Mollier diagram can be used to help illustrate the relationship between temperature, pressure, and the specific enthalpy of water in its different phases.
Mollier diagram
A Mollier diagram, sometimes referred to as an enthalpy-pressure chart, illustrates the relationship between the temperature, pressure, and enthalpy of a substance. Mollier diagrams are used to visually map out steam generation operations within a brewery. They are also used for determining operating temperatures and pressures in refrigeration systems, which we will discuss later in this unit.
The Mollier diagram for water is shown in the figure below.
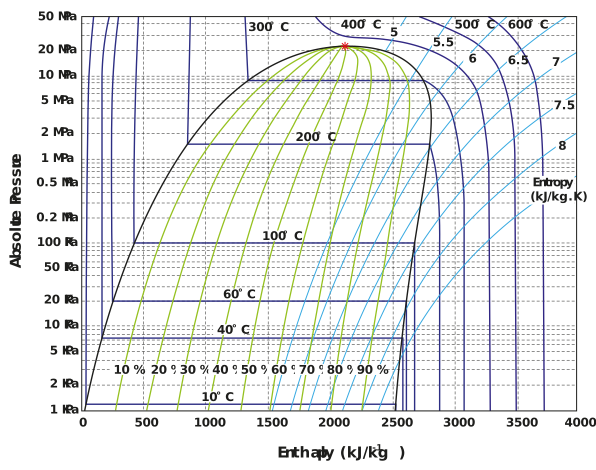
Figure: Mollier diagram for water
The Mollier diagram may look overwhelming at first, but we will explain how to use it now. This should help to unpick it, and make it seem a little less daunting.
-
The x-axis is the specific enthalpy in KJ Kg-1. The y-axis is the absolute pressure in kPa/MPa. When we reference this diagram in examples the units will be referred to as kPa a / MPa a as the ‘a’ indicates absolute pressure.
-
The dark blue lines represent temperature and are called isotherms, which are measured in °C. They start at the top left, travel down vertically, then move to the right horizontally, and again down vertically.
-
Water exists as a mixture of liquid and vapour inside the upside down ‘U’ shape; this is called the ‘phase envelope’. To the left of the phase envelope, we have water as purely liquid. On the right, we have water as purely vapour.
-
The green lines in the phase envelope are quality lines. We will discuss steam quality in more detail later on in this lesson. Steam with a quality of 10% consists of 10% gas and 90% liquid, in equilibrium.
-
The critical point is at the top of the phase envelope and is labelled with a red star. For steam, the critical point occurs at 374.15°C and 22.12 MPa a. Above this pressure, the steam is termed supercritical, and no well-defined boiling point applies.
-
The light blue lines are constant entropy lines, which are useful when designing pumps and compressors. Entropy is another measure of thermal energy. Without going into too much unnecessary detail, compressors and pumps work ideally at constant entropy. We will discuss this some more when we explore the designing of compressors in later lessons.
Using a Mollier diagram, we can determine the enthalpy of water given certain parameters. As an example, the enthalpy of steam with a quality of 10%, a pressure of 20 kPa a, and a temperature of 60°C, is 500 KJ Kg-1.
Before moving on, take a second to confirm for yourself that the above statement is true.
There are a few more points to make about steam using the Mollier diagram. As we discussed earlier, water exists as a solid, liquid, gas, or a mixture of these phases. A liquid, just before it begins to evaporate, is known as a saturated liquid. It is saturated because it is holding the most amount of energy possible before it starts to vaporise. On a Mollier diagram, the saturated liquid line starts at the critical point and follows the ‘U’ shape down to the left.
As water is vaporised into steam, the quality becomes important. The amount of water that has evaporated into gas is known as the ‘quality’. The quality starts at 0% for a saturated liquid, and becomes 100% as a saturated vapour. At the point that all the water has evaporated into steam, we have a saturated vapour. The saturated vapour line starts at the critical point, and follows the ‘U’ shape down to the right.
Now that we have described how to read a Mollier diagram, let’s look at an example to explore how it is used.