
Lesson 5 - Wort and Beer Analysis SAQ
This lesson enables you to test yourself on the material covered in the Beer and Wort Analysis lesson, and determine the level to which you have met the learning outcomes.
Suggested Response - Q3
**The table below contains a sample of results from analysis of bitterness carried out on a brand of beer. Showing your workings, calculate the standard deviation for the sample data s and z-score for result number 6 from the data below.
|
Result |
IBU |
|
1 |
23 |
|
2 |
18 |
|
3 |
20 |
|
4 |
21 |
|
5 |
20 |
|
6 |
19 |
|
Sample mean |
20.17 |
|
Total |
121 |
Response:
Standard deviation σ is given by this equation
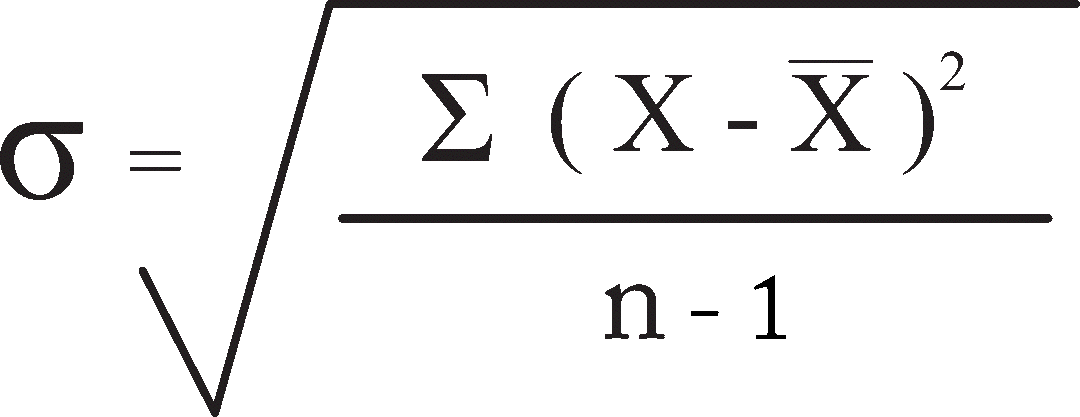
X = the individual result
 = the mean result
n = number of results
To calculate (X – )2 for each of the results:
1 = (23 – 20.17)2 = 8.01
2 = (18 – 20.17)2 = 4.71
3 = (20 – 20.17)2 = 0.029
4 = (21 – 20.17)2 = 0.69
5 = (20 – 20.17)2 = 0.029
6 = (19 – 20.17)2 = 1.37
Sum = 8.01 + 4.71 + 0.029 + 0.69 + 0.029 + 1.37 = 14.84
n – 1 = 6 – 1 = 5
Sum (X – )2 / n – 1 = 14.84 / 5 = 2.97
σ = square root of 2.97 = 1.723
To calculate z-score for sample number 6:
z = (x – ) / σ
z = (19 – 20.17) / 1.723 = -0.68