
Lesson 2 - Mashing Biochemistry
This lesson deals with the biochemical aspects of mashing. We will meet the main substrates and the enzymes that break them down. We will learn what enzymes are, how they operate and how they are affected by the environment of the mash. Finally, we will cover how starch is gelatinised, liquefied and saccharified to make a wort with the desired sugar spectrum.
Effect of Temperature and pH
All enzymes have temperatures and pHs where they are happiest and perform at their best. Moving away from these optima reduces reaction rates and can denature the enzyme.
As with most chemical reactions, enzyme-catalysed reaction rates increase as the temperature is raised. A key difference with enzyme-catalysed reactions is that above a specific temperature, the reaction ceases.
Reaction temperature variations as small as 1-2°C may cause changes of 10-20% in the reaction rate.
The reaction rate of enzyme-catalysed reactions increase with temperature to a maximum level, abruptly falling off with further temperature increase. The increase in rate with temperature is due to there being more energy available for the reaction to occur. The abrupt drop off is due to the enzymes becoming denatured. The graph below shows how enzyme-catalysed reaction rates are affected by temperature.
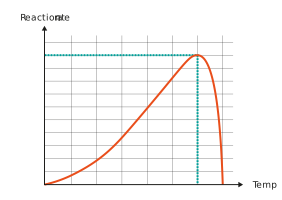
Figure: Effect of temperature on enzyme-catalysed reaction rate
It is important to appreciate that when the temperature is close to the point where the enzyme is denatured, the longer the enzyme is held at that temperature, the more the structure is affected and the greater the decline in its performance. We are almost cooking the enzyme! In mashing, the thickness of the mash can help to protect the enzymes from temperature fluctuations delaying their denaturation.
Enzymes are also affected by changes in pH. Extremely high or low pH values generally result in denaturation for most enzymes, but the rate of reaction with increasing pH drops away more slowly than we saw with temperature. This is shown in the figure below.
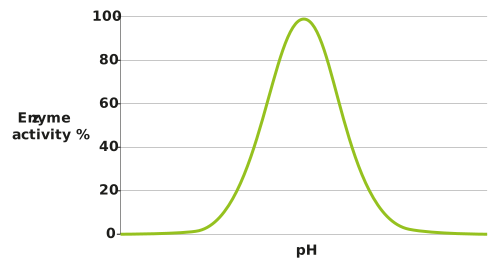
Figure: Effect of pH on enzyme-catalysed reaction rate
The pH value that provides the optimum rate (represented by the peak in our graph) varies from one enzyme to another. Most brewing enzymes have an optimum pH of between 4.5 and 6.0.
The pH of a solution is a measure of its acidity. The ‘p’ is a mathematical symbol that represents the -log of something. The ’H’ represents the concentration of hydrogen ions present.
The more hydrogen ions that are present, the more acidic it is, and in turn, the lower the pH will be.
The table below shows some of the substrates, temperature and pH optima and inactivation temperatures for our mashing enzymes.
Table: Mashing enzymes, their substrates, optimum temperatures and pHs and inactivation temperatures
|
Enzyme |
Substrate |
Temperature Optimum (°C) |
Inactivation Temperature (°C) |
pH Optimum |
|
Pentosanases |
Pentosans |
35-65 |
70 |
4.5-6.5 |
|
Endo β-(1,4) glucanase |
β-Glucans |
37-45 |
55 |
4.5-4.8 |
|
Endo β-(1,3) glucanase |
β-Glucans |
50-60 |
65 |
4.5-4.8 |
|
Barley β-glucanase |
β-Glucans |
40 |
63 |
4.7-5.0 |
|
β-Glucan solubilase |
Proteins |
60 |
73 |
6.35 |
|
Endoproteases |
Proteins |
45-50 |
65 |
4.0-5.5 |
|
Carboxypeptidases |
Proteins |
45-50 |
70 |
4-6 |
|
Aminopeptidases |
Proteins |
50 |
> 70 |
4.8-5.2 |
|
α-Glucosidase |
Starch |
40-45 |
70 |
4.6 |
|
Limit dextrinase |
Starch |
60-62.5 |
68-70 |
5.4-5.5 |
|
β-Amylase |
Starch / α-Glucans |
63-65 |
68-70 |
5.4-5.6 |
|
α-Amylase |
Starch |
70-75 |
75-80 |
5.3-5.8 |
|
Lipase |
Lipids |
55-65 |
70 |
6.8-7.0 |
|
Lipoxygenase |
Free fatty acids |
45-55 |
67 |
6.5-7.0 |
We should also note that the enzyme:substrate ratio helps determine the rate of reaction. If all other factors are kept constant, malts with a higher concentration of enzymes will break starch down faster. If the enzyme concentration is kept constant and the substrate concentration is gradually increased, the reaction rate will increase until it reaches a maximum.
As well as being affected by temperature and pH, enzymes can be inhibited by other substances in solution. An example of this in mashing is the starch degrading enzyme α-amylase being inhibited by phytic acid.
Many enzymes are inhibited by the products of the reactions they catalyse.
Next, we will provide some brief descriptions of the starch degrading enzymes and their functions.