
Lesson 8 - Brewing with Hops
This lesson deals with brewing with hops. Topics covered include: the effect of when hops are added, the equipment required, selecting hops and hop addition calculations.
Analysing Hops
All hops that we purchase must be analysed for the parameters that affect yield and beer quality. In large breweries this is done in house. Smaller breweries rely on the suppliers’ results.
The sample taken from the hops must be as representative of the whole batch as possible. With whole hops this is very difficult. The EBC recommend taking 10-15 g samples from every bale and combining them in the sample for analysis. Failing that 200 g samples can be taken from a set number of bales. This number is the square root of the total number of bales. So, if the batch is in 64 bales we must sample 8 bales. Less than 10% of the sample must come from the surface layer.
For hop products the EBC recommend random 100 g samples from 0.2% of the packages in the consignment with a minimum of 3 samples.
α-Acids measurement
To measure α-acids level we can use the following analyses:
- Lead conductance value (LCV)
- Ultraviolet (UV) light absorbance
- High pressure liquid chromatography (HPLC)
Lead conductance value (LCV)
This analysis works on the basis that a lead acetate solution conducts electricity very well, while a solution of α-acids in solvent does not. Lead acetate reacts with α-acids to form a precipitate, so while there are α-acids in solution, lead acetate cannot dissolve. When the α-acids have all been used up, the lead acetate goes into solution and the conductivity of the solution suddenly increases.
To undertake the analysis we extract the hop acids using toluene and measure the conductivity of the solution. An acidified lead acetate solution is slowly titrated into the hop solution and the conductance of the solution is monitored. When the point at which conductivity starts to rise is reached, the volume of lead acetate solution added by this point is recorded. The amount of lead acetate solution added is the LCV and is proportional to the α-acids level in the hops.
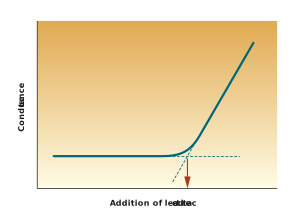
Figure: Measurement of LCV
Ultraviolet light absorbance spectrophotometry
The absorbance of a toluene extract of hops is measured in the UV range at three different wavelengths:
- 325 nm – which measures α-acids.
- 355 nm – which measures β-acids.
- 275 nm – which measures background absorption for α-acids and β-acids.
Using the absorbance values, the quantities of the two hop acids can be calculated from the following equations:
- Concentration of α-acids (% w/w) = 73.79A325 – 51.56A355 – 19.07A275
- Concentration of β-acids (% w/w) = 55.57A355 – 47.59A325 + 5.10A275
Spectrophotometry can also be used to measure the bitterness level in the wort or beer. Results are reported in bitterness units (BU) or international bitterness units (IBU).
In this method 10 mL of degassed, acidified beer is extracted with 20 mL of iso-octane. After centrifugation, the absorbance of the iso-octane containing the extracted iso-α-acids is measured in a spectrophotometer against a blank of pure iso-octane, at a wavelength of 275 nm. The measured absorbance is then entered into the following equation:
International Bitterness Units (IBU) or Bitterness Units (BU) = Factor x Absorbance
The factor used depends on the type of hop product used and the stage of the addition. The different factors take the perceived bitterness provided by the hop product into account. The table below is from the EBC Manual of Bitterness Analysis and shows the factors for a range of hop products and addition stage.
Table: Factors for calculating bitterness units
|
Hop product and timing |
Factor |
|
Whole hops, non pre-isomerised pellets and extract added to kettle |
50 |
|
Pre-isomerised pellets or extract added to the kettle |
55 - 58 |
|
Pre-isomerised extract added post fermentation |
65 - 70 |
|
Reduced iso-α-acids |
70 - 73 |
If the factor 50 is used, the measurement can be called IBU. For all other factors it should be called BU.
High pressure liquid chromatography (HPLC)
In an HPLC a solution of hop acids in di-ethyl ether is injected into a column. As they flow through the column, the component homologues of α-acids and β-acids (such as humulone, colupulone) are separated on the basis of their affinity (readiness to stick) to the column lining and emerge at different times. Each homologue leaves the column after a specific time. The absorbance of the liquid leaving the column is measured at 314 nm using a spectrophotometer. The amount of absorption is proportional to the concentration of the hop acid (reported in % weight of hop). Using HPLC allows the full spectrum of bitter acids to be measured in each hop variety, creating a fingerprint for that particular variety. A similar method is used for measuring iso-α-acids in wort and beer, with results reported in mg/L.
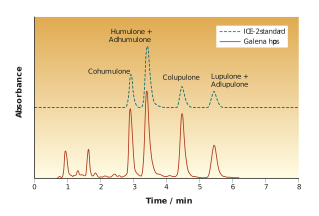
Figure: HPLC chromatogram measuring bitter compounds in Galena hops
HPLC is the most accurate method for determining levels of each acid, and the total level of iso-α-acids in beer. It can also be used to determine the polyphenol content.
Total essential oils analysis by steam distillation
Total essential oil content is analysed using steam distillation. 100 g of hops are added to 3 litres of water and steam distilled over three hours with 8 mL/min of distillate collected. After distillation, the volume of essential oils in the distillate trap is measured and reported as mL/100 g.
Essential oil components by gas chromatography with flame ionisation detection (GCFID)
To analyse each component of the essential oils 100 μL of distilled essential oil is mixed with 900 μL of pentane or hexane to produce a 10% solution. 1 μL of the 10% solution is injected into a gas chromatography (GC) column. Like HPLC, GC separates components of a mixture by their affinity for the column lining. If the component of interest has a low affinity for the lining, it passes out of the column rapidly. If it has a high affinity, it takes a lot longer. Each component leaves the column at a specific time. When the sample is injected into the GC it is vaporised. The vapour is then carried through the GC column. The gas leaving the column is mixed with hydrogen and air and is ignited and passed across a flame ionisation detector. The detector measures the electrical current conducted by the ions and electrons in the flame from the ignited gas. In the same way as in the HPLC figure above, readings from the detector appear as peaks on a graph. A computer uses the area of each peak as a proportion of the total area of peaks on the graph, to calculate the percentage of the component.