
Lesson 9 - Control of Fluid Flow 1 SAQ
This lesson allows you to test yourself on the material covered in the Control of Fluid Flow 1 lesson and determine the level to which you have met the learning outcomes.
Suggested Response - Q7
**/***
a) A bright beer main of 100 mm internal diameter is 80 m long. The friction factor can be considered a constant at 0.005. (This is not a function of line velocity and is a simplification to assist you in the calculation. We know from our previous studies that friction factor is a function of line velocity). Sketch the characteristic curve for the pipeline between 0 and 1,000 hL/h. Represent the pressure drop as a head in metres of water (ρ = 1,000 kg/m3).
b) If the pump from question six was used to supply the bright beer main, and a zero-suction head condition existed, what would be the supply flow rate?
Bright beer properties are ρ = 1,010 kg/m3 and µ = 3 cP.
Response:
a) The characteristic curve is a plot of flow rate (or capacity) against pressure drop (or total head). In order to determine the pressure drop, we will use the Darcy-Weisbach equation and apply it for a range of flow rates 0 to 1,000 hL/h:

For a flow rate of 100 hL/h, we need to determine the mean velocity. We will do this from the continuity equation:

So, rearranging for u:

And substituting this into the Darcy-Weisbach equation gives:


Expressing this as a head of water:


This set of calculations would be repeated for the complete flow rate range. It is probably easiest to do this is in a spreadsheet to yield the following data:
|
Q (hL/h) |
0 |
100 |
200 |
300 |
400 |
500 |
600 |
700 |
800 |
900 |
1000 |
|
∆H (m) |
0 |
0.2 |
0.8 |
1.9 |
3.3 |
5.2 |
7.4 |
10.1 |
13.2 |
16.7 |
20.6 |
These data are plotted below:
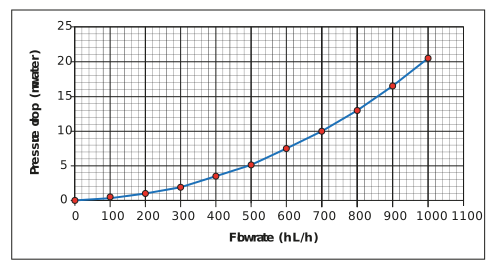
b) To determine the flow rate that the pump would supply to this line, we need to plot the pump and the pipe characteristic curves. Where they intersect will give us the flow rate. This is shown below:
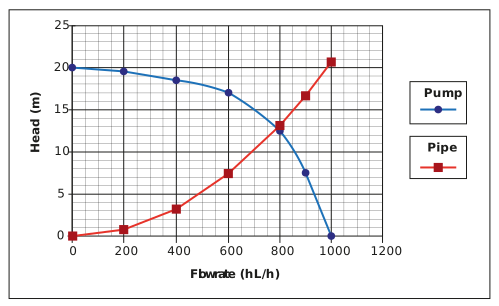
The resulting flow rate would be 800 hL/h (with a pump total head of 13 m water).