Lesson 9 - Control of Fluid Flow 1 SAQ
This lesson allows you to test yourself on the material covered in the Control of Fluid Flow 1 lesson and determine the level to which you have met the learning outcomes.
Suggested Response - Q1
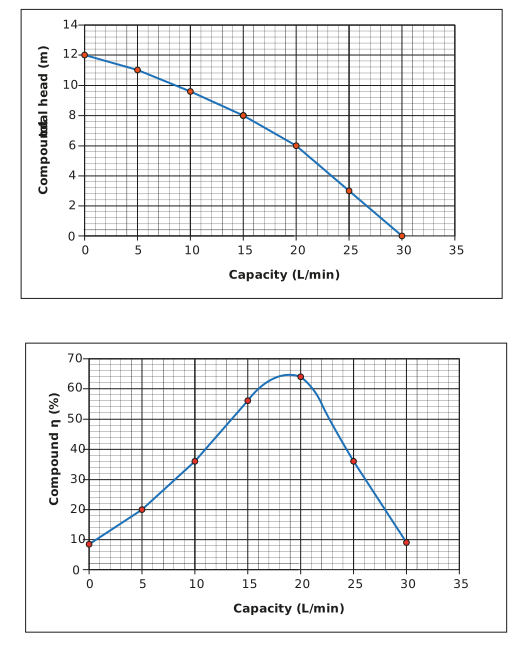
**Two identical centrifugal pumps (pump curve is shown below) are used in series to enhance pumping performance. Sketch the compound pump curve for both pumps.
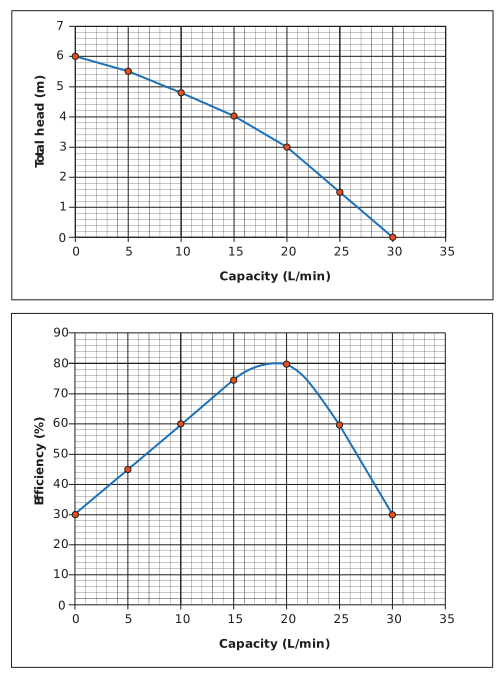
Response:
It is possible to create a compound pump curve to represent two pumps in series by applying the following rules:
-
The head curves are added to produce the compound curve.
-
The efficiency curves are multiplied together to give the compound curve.
Before this can be done, we need to extract the numerical values from the two pump curves (see the table below):
|
Capacity (L/min) |
Total head (m) |
η (%) |
|
0 |
6 |
30 |
|
5 |
5.5 |
45 |
|
10 |
4.8 |
60 |
|
15 |
4 |
75 |
|
20 |
3 |
80 |
|
25 |
1.5 |
60 |
|
30 |
0 |
30 |
Let us take the total head data first. As both pumps are identical, we can add both identical values of head (or more simply, double the head of one pump), for any given capacity, to get the following table:
|
Capacity (L/min) |
Total head (m) |
Compound total head (m) |
|
0 |
6 |
12 |
|
5 |
5.5 |
11 |
|
10 |
4.8 |
9.6 |
|
15 |
4 |
8 |
|
20 |
3 |
6 |
|
25 |
1.5 |
3 |
|
30 |
0 |
0 |
We can now turn our attention to the efficiency data. In order to multiply them together, we cannot use percentage efficiency values, but instead, we need to use fractional efficiencies, (e.g. we would use 0.8 rather than 80%). Why? Well, let us consider for a second, using percentage efficiency data of 80% each. If we multiplied these together, we would get (80 x 80 =) 6,400%.
Any alarm bells ringing? Hopefully so, as we have just created two pumps in series which have a combined efficiency greater than 100 %! In other words, they generate more pumping power than they draw from their electrical supply, which obviously cannot happen.
If we used the fractional efficiencies of 0.8 and multiplied them together, we would get (0.8 x 0.8 =) 0.64. So, the combined efficiency of two pumps running in series would be 0.64, or 64%. Hopefully, the use and interpretation of fractional vs percentage efficiencies are now much clearer.
Let us create the compound efficiency data in the table below:
|
Capacity (L/min) |
η (%) |
Compound efficiency (%) |
|
0 |
30 |
0.3 x 0.3 = 0.09 = 9 |
|
5 |
45 |
0.45 x 0.45 = 0.2025 = 20 |
|
10 |
60 |
36 |
|
15 |
75 |
56 |
|
20 |
80 |
64 |
|
25 |
60 |
36 |
|
30 |
30 |
9 |
Plotting these two sets of compound data is shown below: