
Lesson 7 - Malt Quality SAQ
This lesson provides the opportunity for you to test yourself on the material covered in Lesson 6 (Malt Quality) and determine the level to which you have attained the expected outcomes.
Suggested Response - Q8
**You are asked to buy malt for your brewery. Refer to the CoA for Malt A and B, and answer the following questions:
Table: Malt CoA 1 & 2
|
Parameter |
Unit of measure |
Specification |
Malt A |
Malt B |
|
|
IOB |
EBC |
EBC |
EBC |
||
|
Moisture |
% |
4.5-5.5 |
4.5-5.5 |
4.3 |
4.2 |
|
Extract yield (dry wt) |
l°/kg or % |
>305 l˚/kg |
>80.5% |
79.50% |
79.80% |
|
Corn size >2.5mm |
% |
95 |
95 |
98.37 |
96.8 |
|
Colour |
EBC |
2-4 |
2-4 |
3.9 |
4.15 |
|
Total nitrogen |
% |
1.6-1.8 |
1.6-1.8 |
1.6 |
1.64 |
|
Total soluble nitrogen |
% |
0.57-0.66 |
0.65-0.75 |
0.63 |
0.70 |
|
FAN |
mg/l |
>160 |
>160 |
180 |
173 |
|
SNR |
% |
34-40 |
38-44 |
39 KI |
41 |
|
Friability meter reading |
% |
>85 |
>85 |
87.7 |
86.5 |
|
Homogeneity |
% |
>96 |
>96 |
96.36 |
96 |
|
Diastatic power |
WK |
>65˚ IOB |
>222 WK |
454 |
375 |
|
Wort viscosity |
mPas @ 20˚C |
1.55-1.65 |
1.55-1.65 |
1.49 |
1.52 |
|
DMS-p |
mg/kg |
2-8 |
2-8 |
2.65 |
2.65 |
|
Beta glucan |
mg/l |
<200 |
<250 |
84 |
150 |
|
Additional information |
|
|
|
|
|
|
Acrospire 0-1/4 |
% |
|
|
6 |
1 |
|
Acrospire 1/4-1/2 |
% |
|
|
1 |
5 |
|
Acrospire 1/2-3/4 |
% |
|
|
1 |
4 |
|
Acrospire 3/4-1 |
% |
|
|
90 |
86 |
|
Acrospire >1 |
% |
|
|
2 |
4 |
|
NDMA ppb |
ppb |
|
|
0.5 |
0.5 |
|
*Aflatoxin B1, B2, G1 & G2, ppb |
ppb |
|
|
0 |
0 |
|
Foreign Seeds |
% |
|
|
0 |
0 |
- (a) Assess the β-glucan level. Do you think this will cause issues during the brewing process?
- (b) Explain the difference between total and soluble nitrogen.
- (c) Convert the total nitrogen for Malt A into protein amount.
- (d) How will a low nitrogen value affect the brewing process?
- (e) Describe the process of analysing acrospires.
Response:
(a)
Malt A should not cause any problems for brewing. Although Malt B is within specification, it might cause the following:
- High β-glucan levels tend to increase wort viscosity. This could decrease the wort flow rate during wort separation. For example, lauter tun usage time will likely increase, thus delaying the entire brewhouse processes.
- Barley β-glucanase enzymes will not be active during the brewing process due to heat sensitivity. The residual β-glucan in the wort may be present throughout the brewing process. If carried through to post fermentation, the high β-glucan levels may blind the filters during the matured beer’s filtration causing increased beer loss and potential lost operational time.
(b)
Total Nitrogen (TN) analysis, reports all levels of nitrogenous compounds in the malt; this includes both the soluble and insoluble fractions. Total nitrogen is the nitrogenous compounds (proteins) that are fixed during the growing cycle. Environmental factors, farming inputs and soil nitrogen levels influence this value. The nitrogen level can be converted to a crude protein level by multiplying the nitrogen result by 6.25%. During malting and mashing, some proteins are broken down to produce the soluble fraction. The soluble proteins and peptides produced can be further broken down into free amino nitrogen, which is essential to yeast health. In general, malt made from six-row barley has higher total nitrogen.
(c)
% Protein = % Nitrogen x 6.25
% Protein = 1.6 x 6.25
% Protein = 10
(d)
The level of nitrogen in the malt is an indication of the amount of proteins, polypeptides, peptides and free amino nitrogen (FAN) available from it. FAN is critical for yeast nutrition and good fermentations so a lack of nitrogen in the malt may lead to poor fermentations and off flavours. Protein is also important for foam stability so a low nitrogen malt could produce a beer with poor foam. Proteins and peptides are thought to increase the body of beer so a beer brewed with a low nitrogen malt may taste thin. Proteins react with polyphenols to form haze so low nitrogen malt could produce a beer less likely to become hazy in the package. Enzymes are made of protein so low nitrogen malt may not have sufficient enzyme activity to process adjuncts.
(e)
Malt is boiled in a solution of copper sulphate, which turns the husk translucent, making the acrospires easily visible. 100 kernel lengths are measured and analysed to determine acrospire growth. The analyst judges the acrospires’ growth visually, reporting it as the percentage of grains in the ranges 0-1/4, 1/4-1/2, 1/2-3/4, 3/4-1 and > 1.
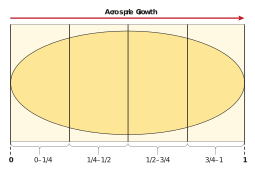
Modification increases as acrospire length increases. When using the CoA, results with high percentages in the 0-1/4 range indicate unmodified grains. Ideal numbers would be in the 3/4-1 range, with > 1 showing over- modification.